
How to debug an Adobe Analytics implementation
31 Jul 2016 » Analytics Tips
In my previous post, I stated that you, as a Web analyst, should know the details of the web analytics implementation. It is not enough to just understand how to navigate through the Adobe Analytics UI; you also need to know how the data arrived there in the first place. In this post, I am going to show three different ways to debug an Adobe Analytics implementation.
Although this post might look a bit too technical, I believe that everybody involved in web analytics should read it. I know that, too often, we tend to categorise ourselves in “technical” or “business”, but some areas are common to both of these categories and what I am going do describe in this post is one of those areas.
Post updates
Originally, I wrote this post back in 2016. As you know, in technology, 5 years is an eternity and a lot has changed since the day this post was published. To my surprise, it has been the highest ranking post since I can remember. I assume that it is very useful to many of you. However, in the meantime, I have written new posts on the same topic, which you should also check to complement the information in this one.
December 2021
The section below on Charles is only a quick introduction to this tool. If you are using it, you will find more useful the following 2 posts:
June 2021
The Adobe Debugger has been deprecated and it cannot be installed anymore. I am leaving the section where I explain it for historical reasons, but you should not follow it. Instead, have a look at my post on the Adobe Experience Platform Debugger and then skip to the Google Chrome developer’s tools.
Solution Design Reference
The basis of the full implementation is this spreadsheet, which you have probably seen somewhere, called SDR. There you have a map of all eVars, props, events and other analytics variables, with their meaning. Anybody connected with the web analytics of an organisation, either from the implementation or the analysis side, should know perfectly well this document. If your organisation does not have one, create one immediately from the existing implementation; if you do not know it too well, start by learning it.
I cannot stress how important the SDR is. In some organisations I have worked with, this is the only documentation they have about their Adobe Analytics implementation. Adobe has a template, which is what I personally use, but my clients tend to tailor it to their own liking.
One final piece of advise: learn it by heart. I know this may sound too much, but most of my customers know all the eVars and props by number and name. It may take a while until you learn them all, but, if you work everyday with the document, it will not be that difficult.
Adobe Debugger
The first tool that should always be at hand of any web analyst, in order to debug the analytics implementation, is the Adobe Debugger (fka Digitalpulse Debugger). It is the simplest tool:
- Navigate to the page where you want to check what data is being sent
- Click on the bookmarklet
- Search for the SiteCatalyst section.
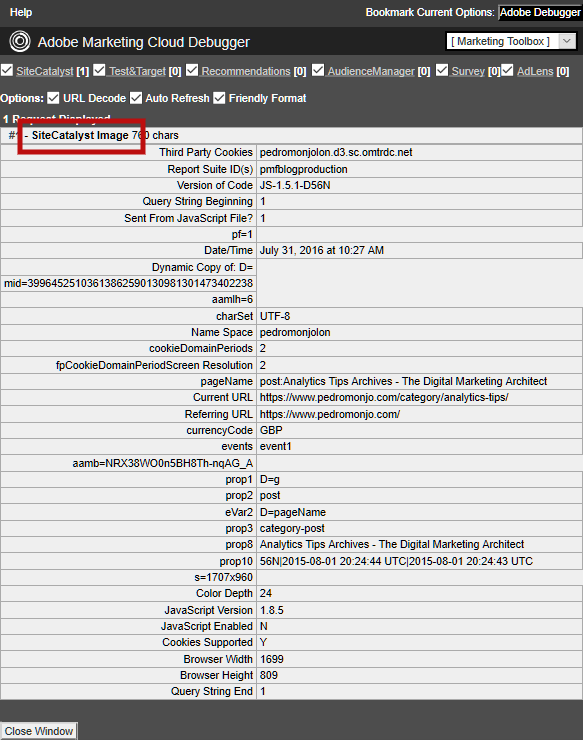
You will be presented with the values that have been collected on that page. The important values for you are the pageName, channel, events, products, eVars and props. You may be tempted to think that, with this tool, you have all you need. However, this tool has some limitations and it should only be used when you know that the data you are going to look for is there. One main limitation is when you have various Analytics calls in one page, this tool will only show one.
Google Chrome developer tools
You should know that Adobe Analytics, like many other web analytics tools, send the data to the servers using a hidden image, which triggers an HTTP request. Analysing this HTTP request is the most accurate way to debug an Adobe Analytics implementation. Most modern browsers offer tools to show these requests.
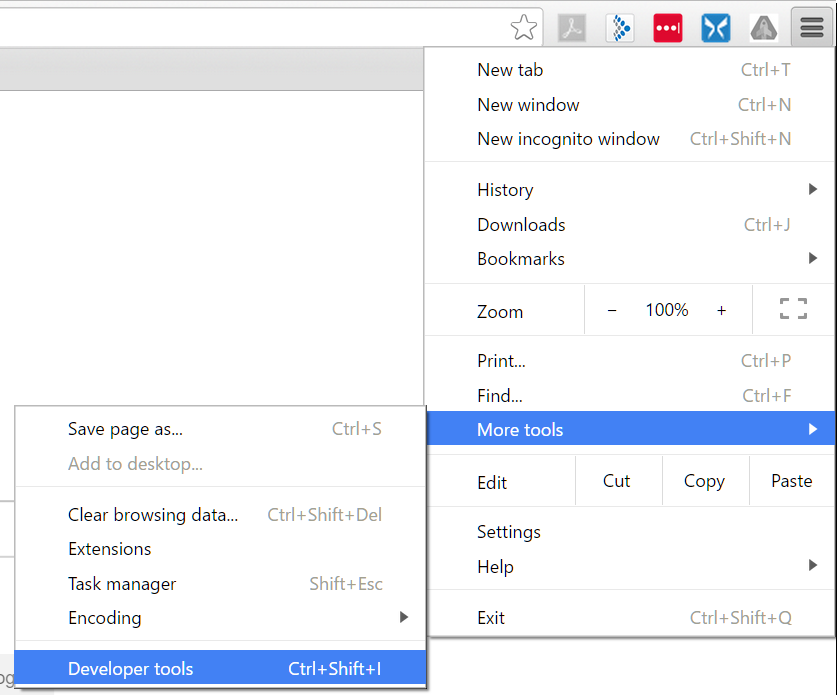
I am was a big fan of Mozilla Firefox. However, I must admit that, when it comes to the developer tools, Google Chrome is much better. In order to enable these tools, click on the menu button > “More tools” > “Developer tools”.
Now click on the “Network” tab and refresh the screen. You will be presented with all the HTTP requests made on that page. We are only interested in the Adobe Analytics calls and the easiest way to find them is filtering by “b/ss”. You might also want to select “Preserve log” to keep the log from page to page. When selecting one of the calls, you need to scroll down to the query string parameters section.
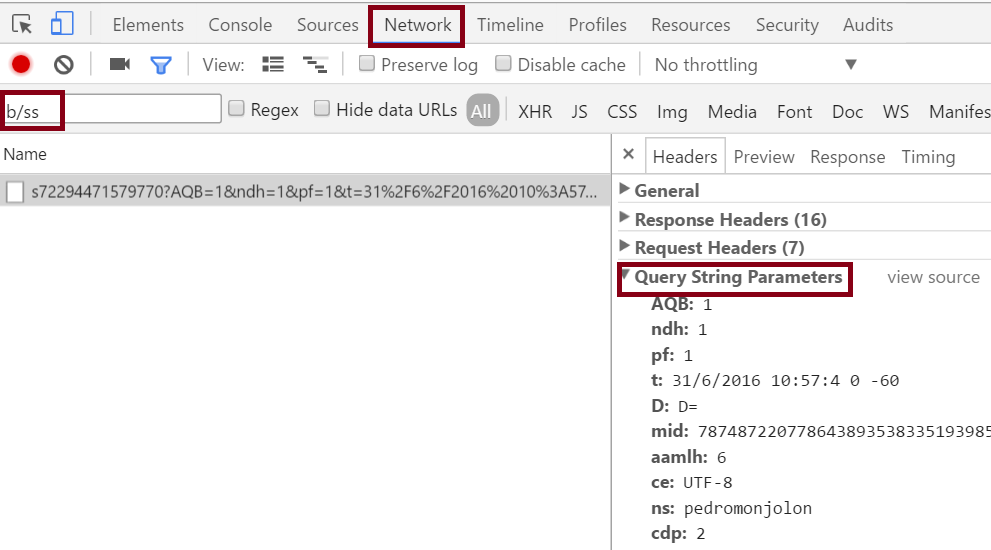
When reading the query string parameters, remember that cX is prop X and vY is eVar Y. If, on a page, you have multiple calls (like the tracking of additional visitor interactions), you will see all of them in this tool. I am generally happy with how the data shown on this tool, but if you want a beautified version of it, you can always install Omnibug.
Charles
The final tool that I am going to briefly explain is Charles proxy. Buy far, this is the best tool to debug an Adobe Analytics implementation. It not only offers the feature to show the HTTP calls, but it can also be used to replace data on the fly, inject calls, save a session, debug mobile apps and many more. You will notice that this tool is not free, but I do not think the price should be a barrier. In any case, there is a free equivalent, called Fiddler, which is a bit more difficult to use.
The “sequence” view in Charles is very similar to Chrome developer’s tools. However, for me, the best way to present the data is using the “structure” view. You can then expand the server name and all calls to that server will be grouped. Clicking on any call will show the details of it. To get your Analytics data, you need to select “Request” at the top and “Query String” at the bottom.
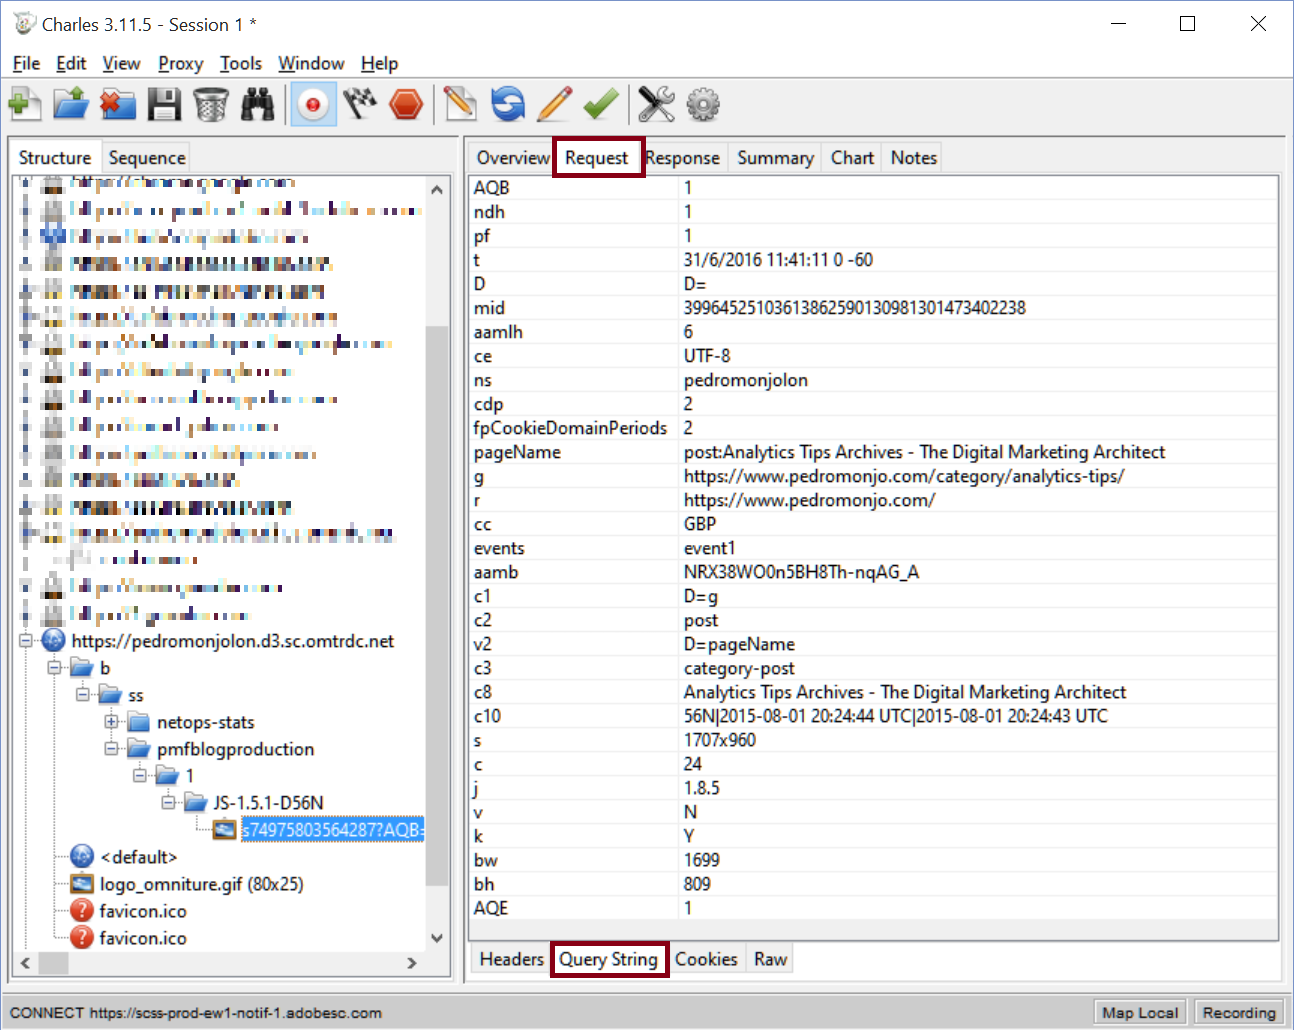
The data, as you can see, is very similar to the information shown Google Chrome (cX for prop X and vY for eVar Y).
Debug the data
By now you will probably be wondering: “OK, I now have the data; and now, what?” Each implementation is completely different from the next one and the previous one, so there is no “cookbook” on what to do with the data. Ideally, you should have the technical specifications, where it details how to debug the Adobe Analytics implementation. However, if you do not have this document, there are a few things you should ask yourself and compare your expectation with the data:
- Is the naming convention followed? This is especially important in the pageName.
- Are there any data values completely wrong?
- Is there any useless data?
- Are you missing any data, which you would expect to be in the request?
- Are there any variables in the request, which should not be there? Remember that the instances metric and pathing reports could be affected with unexpected data?
- How many requests are there per page? Adobe charges by the server call, so adding more calls increases the cost of the license.
- Is there any PII? No PII must ever be sent to Adobe Analytics (or Audience Manager).
- If an eVar is not set, but you are expecting a value there, could it be that it was captured in a previous call?
Finally, I would like to know how you debug an Adobe Analytics implementation and which other tools you use. Feel free to share your experience in the comments section.
Image by rawpixel.com