Debugging Adobe Tools with Charles - Part I
14 Nov 2021 » MSA
Now that I have provided an introduction to HTTP Debuggers, I can explain how to use Charles to debug Adobe tools. In this post, I will show you how to start working with Charles, find the Adobe data and switch Launch environments.
Configuration
Proxy
The first thing you need to remember about Charles is that it is a proxy. This means that it is designed to sit between your browser and the web servers. In other words, you must force all web traffic to go through Charles.
By default, Charles takes care of that, by configuring the operating system to use it as the default proxy. Then, all browsers configured to use the system-wide proxy configuration will automatically send to Charles all traffic. I have not tested in macOS or Linux (although I am writing this post from my Ubuntu). Also, if you have changed your browser’s proxy settings or your company does that for you, you will need to change it manually.
If you need help with the configuration, you can start with the Configuration help section.
SSL certificates
When Google stated that it would promote HTTPS capable websites over HTTP-only websites, everybody rushed to configure their web servers with SSL certificates, including me. One direct consequence was that proxies could not read the traffic without raising the alarms. In general, that is a good thing, but if what you are planning is to play with this traffic, it becomes a nuisance.
I am not an expert in security nor certificates and it is beyond this post to explain them. What I can tell you is that you need to install Charles auto-generated certificates in your system or browser, so that your browsers do not complain about security threats every time you start debugging a new domain. Just follow the instructions in Charle’s help for SSL Certificates.
Getting used to Charles
When you start using this tool, you will see that it has many, many features. It may even seem overwhelming. However, you do not need to understand all of it. If it helps, I have used it extensively and I do not know all its features, only those that I need.
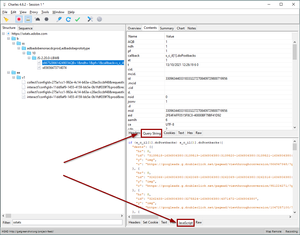
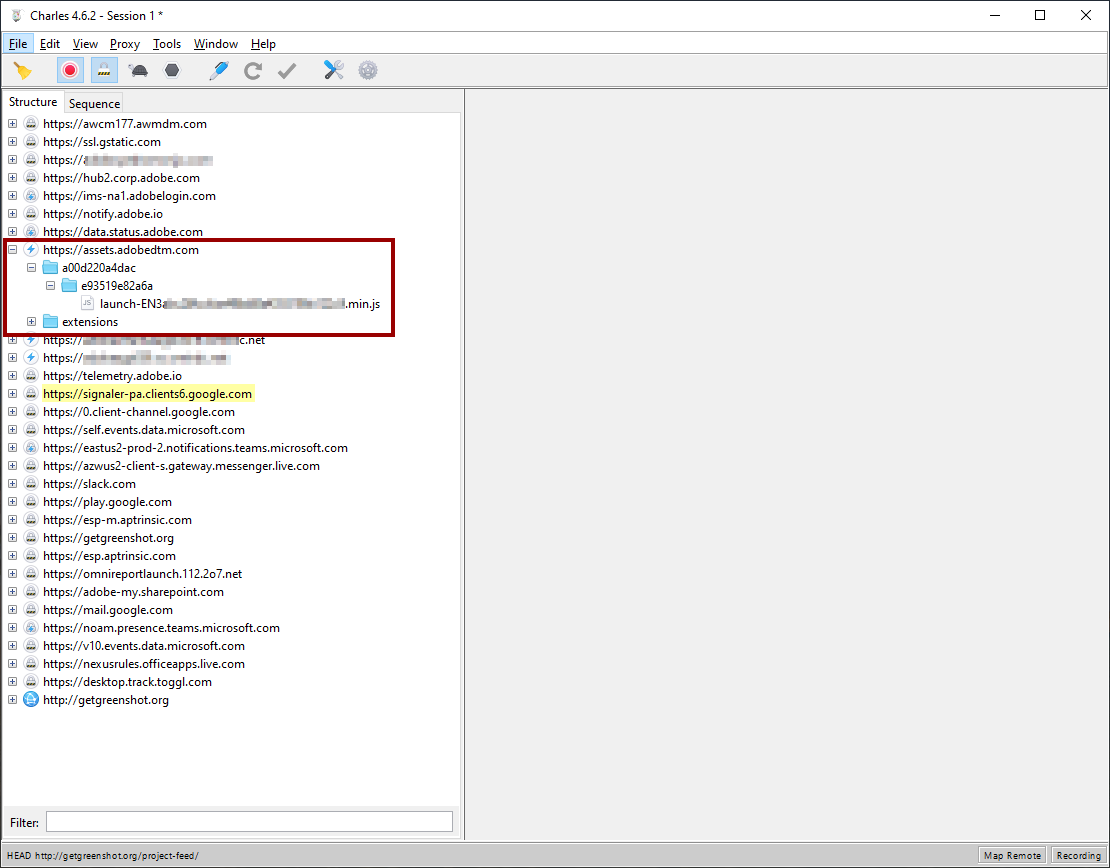
When you launch it and you start seeing traffic going through it, this is what you will see:
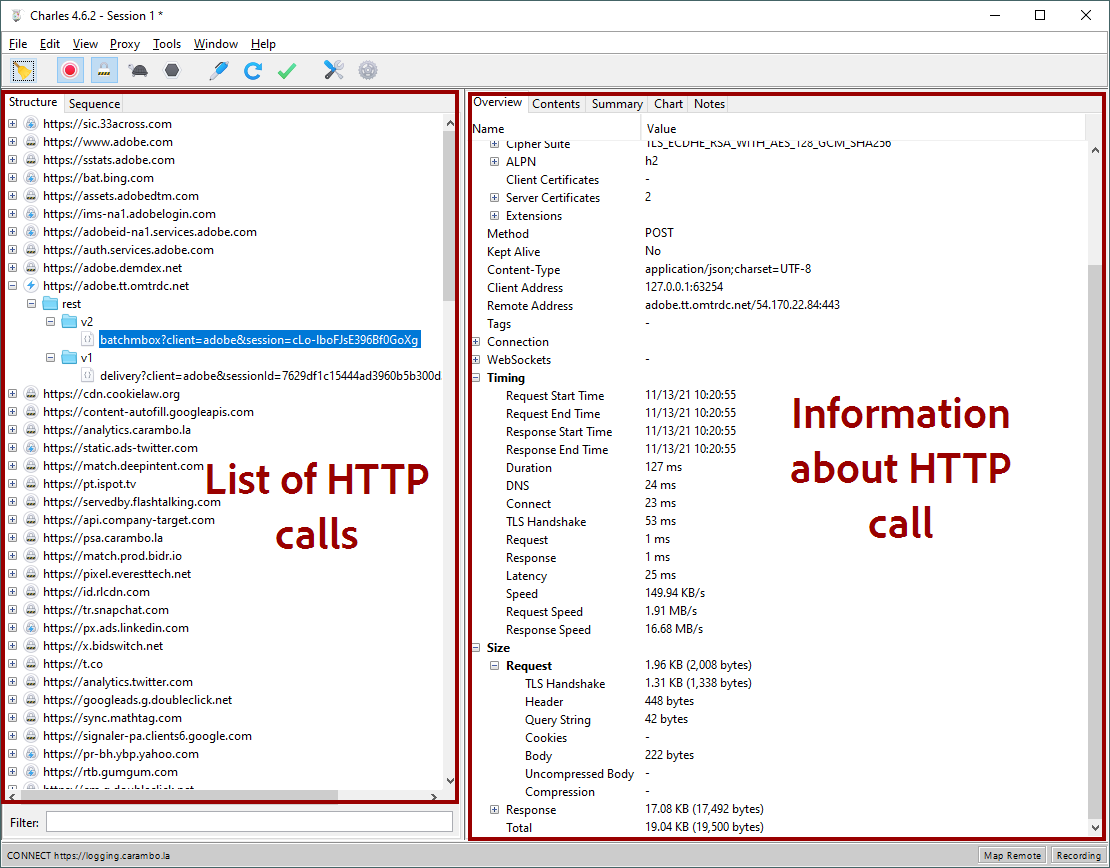
There are two panes:
- On the left, you have the list of calls. You can have them grouped by domain (Structure tab) or ordered by time (Sequence tab). I always use the former, which is clearer to me.
- On the right, Charles offers all sorts of information about the selected HTTP call. More about it next.
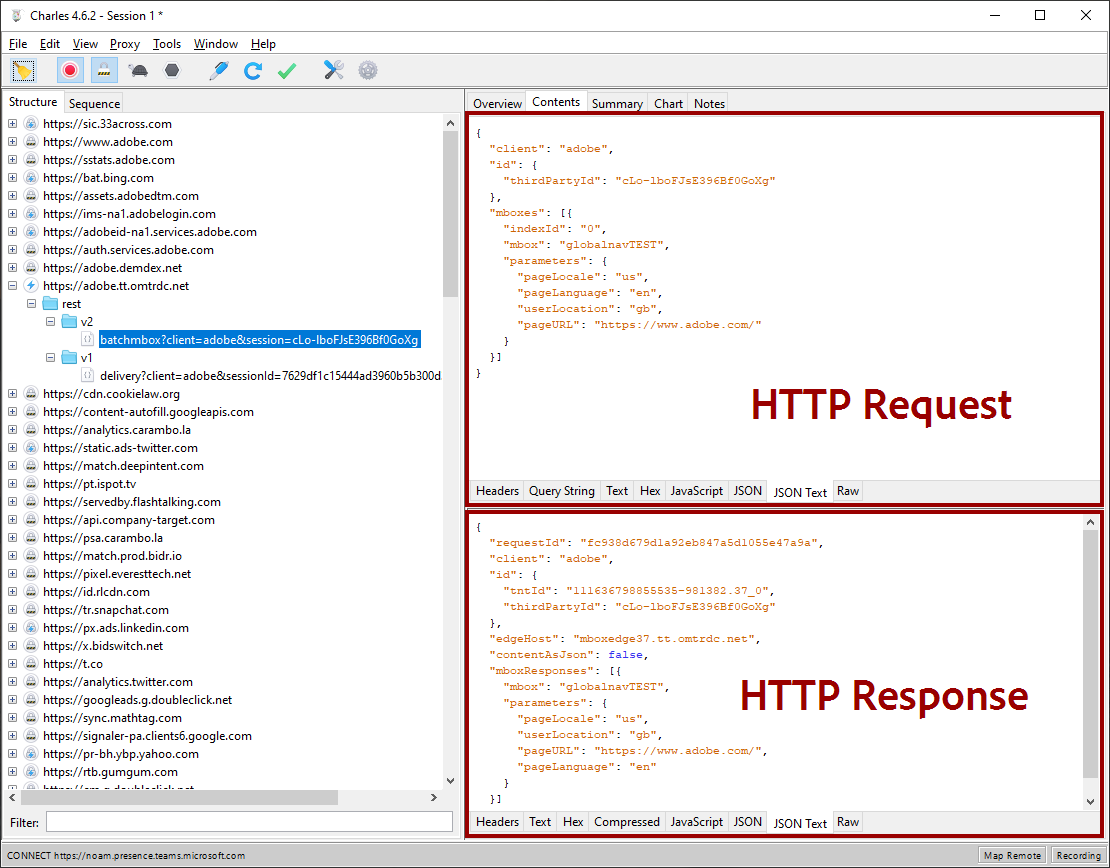
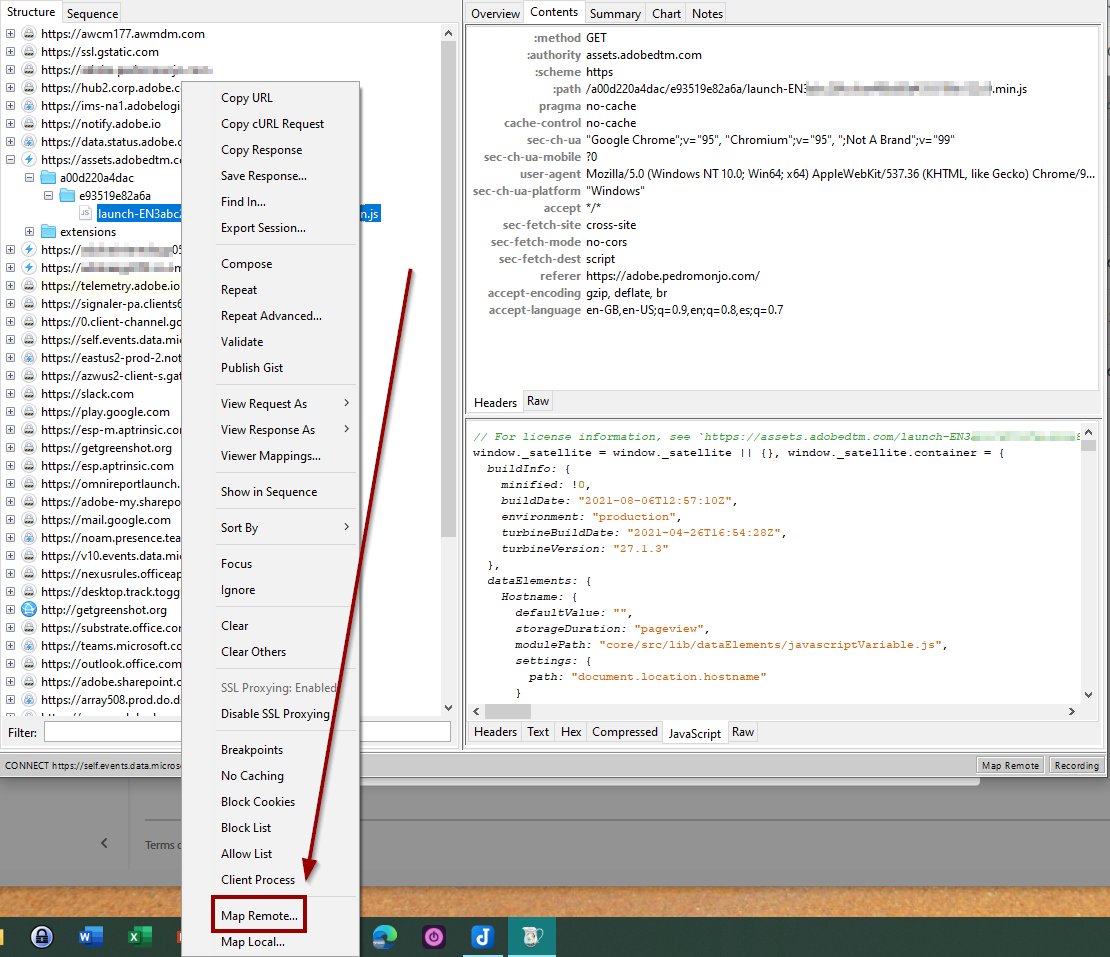
For debugging purposes, the Content tab at the top is the one that you will spend most of your time on. It has two sub-panes:
- At the top, you have the HTTP request.
- At the bottom, you can see the HTTP response.
Feel free to click on all the tabs at the bottom of each sub-pane.
One final tip: if the data in the left pane gets difficult to manage, clicking on the broom button at the top will delete all information previously captured.
Where to find Adobe data
When working with Adobe tools, you should select the HTTP call you want to review and, as stated above, select the Content tab. Then, depending on the Adobe tool:
- For Adobe Experience Cloud (AEC) tools, like Analytics or Target, select:
- Domains you need to first look for on the Structure tab:
- Adobe Analytics:
[namespace].sc.omtrdc.netunless you are using your own CNAME - Adobe Target:
[client-code].tt.omtrdc.net - ECID service:
dpm.demdex.net - Adobe Audience Manager:
[partner-code].demdex.net - Adobe Experience Platform or Web SDK implementations: ``
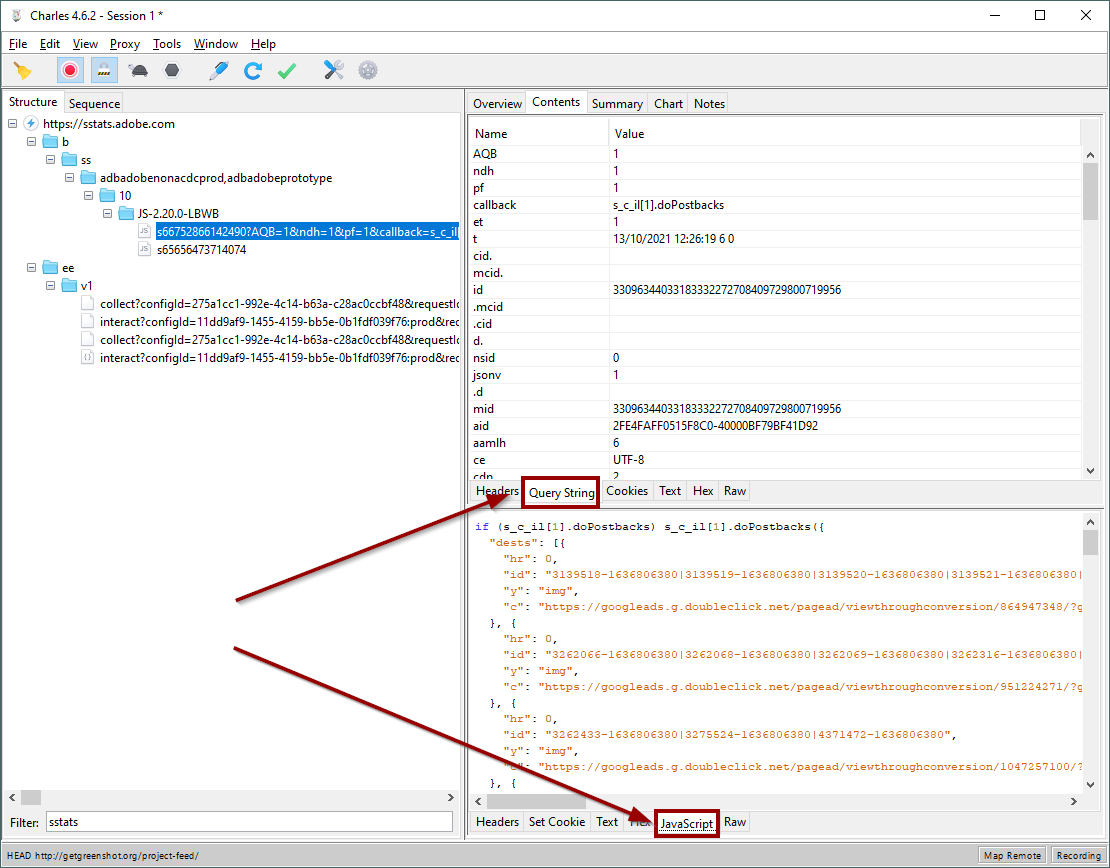
- Adobe Analytics:
- In the HTTP request, the Query String tab. Traditionally, AEC tools have sent the data using query string parameters. This tab will show you the key-value pairs nicely decoded.
- In the HTTP response, the Javascript for Analytics or JSON Text tab for the rest of the tools.
- Domains you need to first look for on the Structure tab:
- For Adobe Experience Platform (AEP) tools or, more specifically, Web SDK, both HTTP request and response data is found mainly in the JSON Text tab.
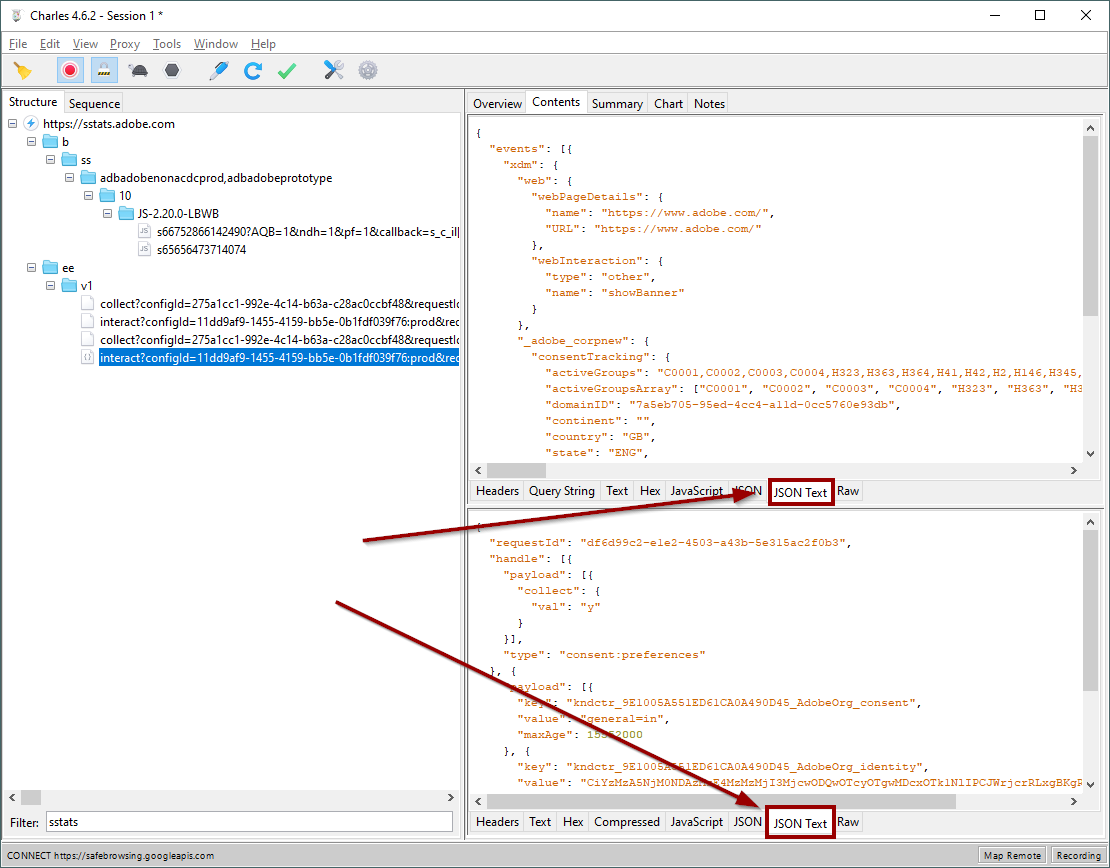
One final comment: I personally prefer the JSON Text tab. However, the JSON tab may be more helpful to you. Either show the same information.
SSL traffic sniffing
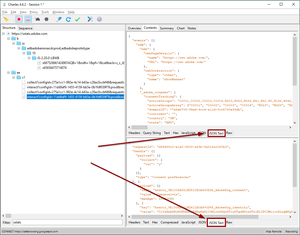
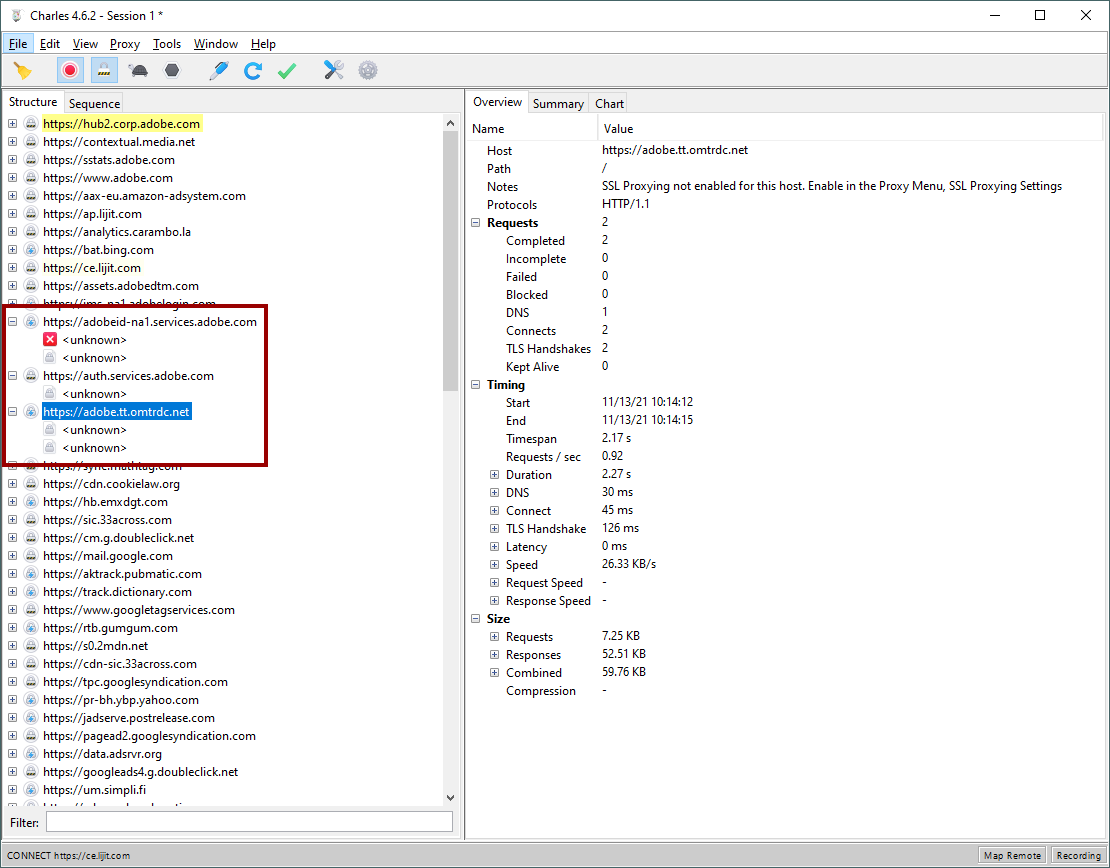
Even if you have configured the SSL certificates correctly, by default, Charles does not interfere with SSL traffic. This is what you will get (see the notes on the left pane):
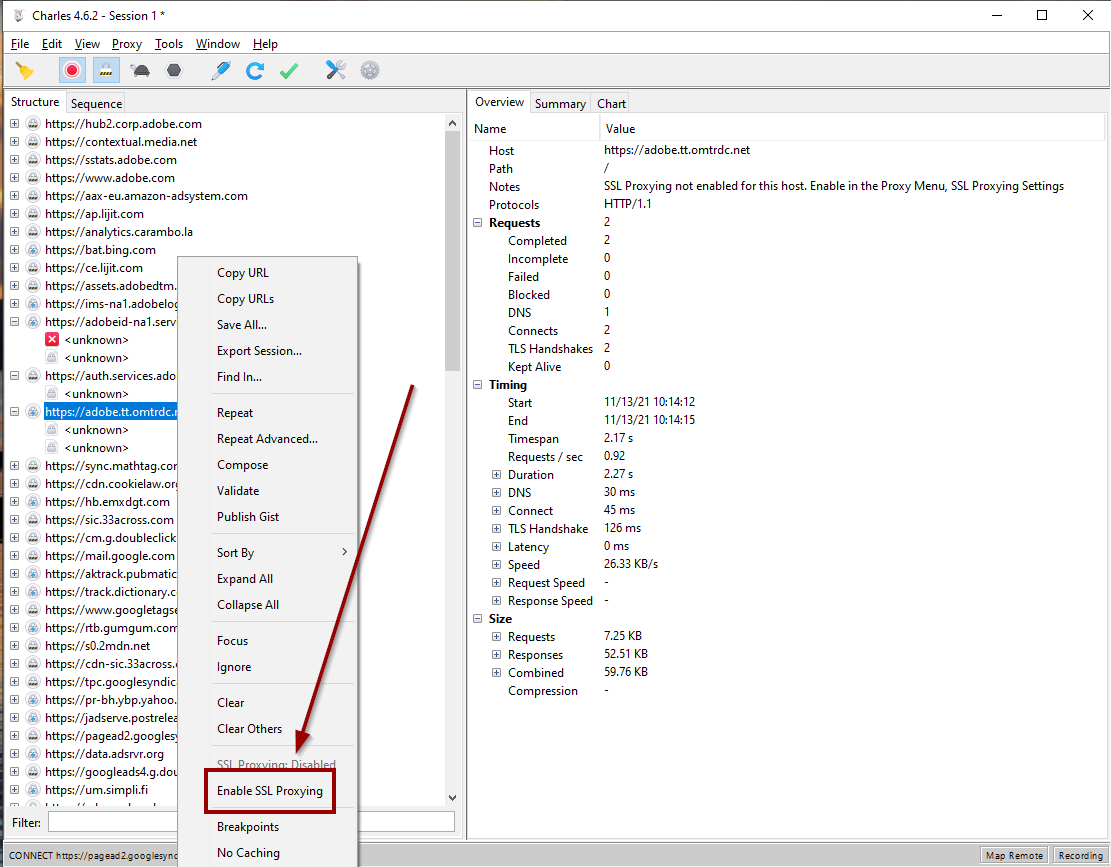
You need to explicitly tell Charles to start decrypting the SSL traffic from the domains you want. To do that, you right-click on the domain and select “Enable SSL Proxying”:
Then, you must refresh the web page in your browser for Charles to start showing you the HTTP data:
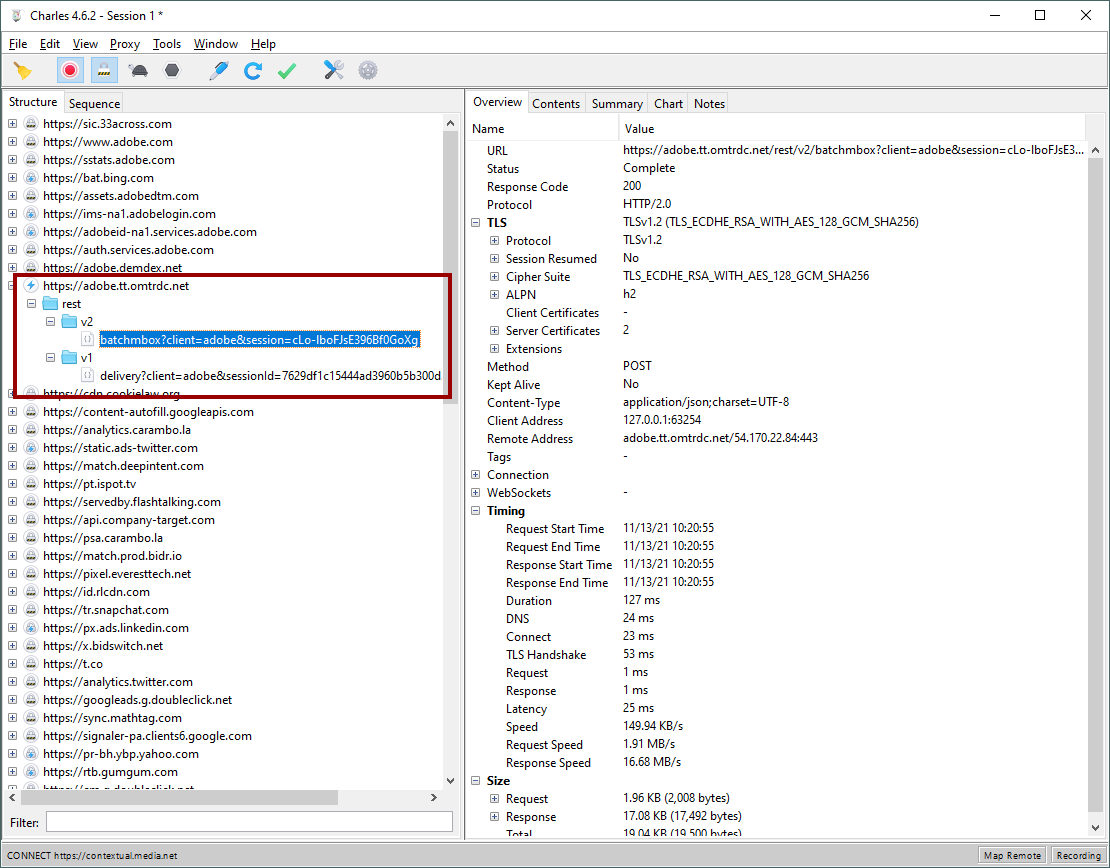
You will have noticed that the icon next to the domain has also changed. You may also want to select “Focus” from the context menu, to show only the list of interesting domains, but this is not strictly necessary.
Switch Adobe Launch environments
We will now configure Charles to, for a given URL, fetch a different URL.
- Go to the website that you want to debug.
- In Charles, make sure that you can see the call to Launch code. The host you should be looking for is
assets.adobedtm.com. I also assume that you have enabled the SSL proxy for it.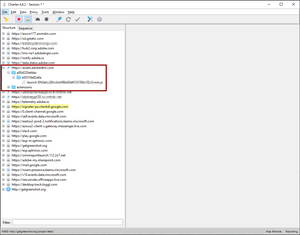
- Go to https://launch.adobe.com/.
- Navigate to the
WebTag Property you are working on. - Select Environments from the left menu. You should get, at least, “Production”, “Staging” and “Development”.
- Under the INSTALL column, there is a box icon. Click on the icon corresponding to the “Production” environment. This will show you the code for production.
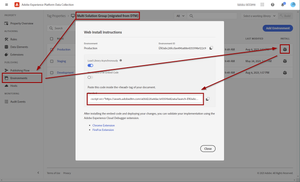
- Make sure that the URL you get here is exactly the same you see in Charles.
- Close the dialogue and click on the box icon next to the environment you want to switch to. Copy the URL somewhere (I usually use Notepad++); you will notice that the URL has
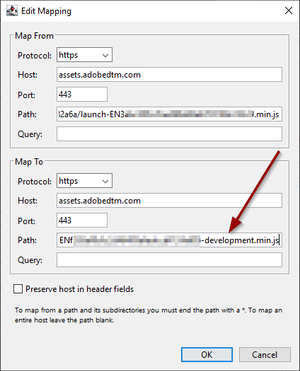
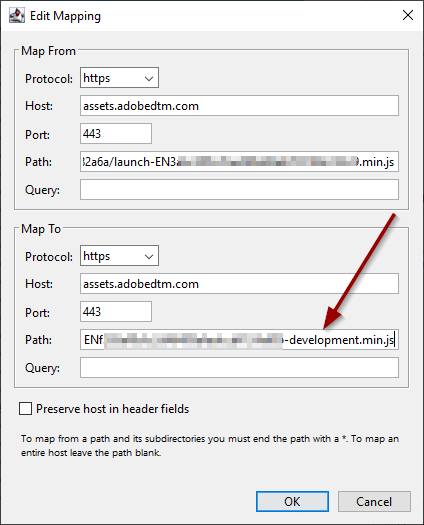
-developmentor-stagingin it. - Back in Charles, right-click on the production Launch URL and click on “Map Remote…”

- In the new dialogue, in the Map To section, put all the values from the URL in step 8 (I believe that only the new path is needed, but I will put all values):
- Protocol: I assume you are now always using HTTPS.
- Host: same as before,
assets.adobedtm.com. - Port: 443
- Path: everything after the hostname in the URL
- Click on OK
- Back in the browser, do a hard refresh on the page, i.e. clear the cache and refresh. You should now be getting the Launch environment you are interested in.
- If you check Charles now, you will see 2 entries for
assets.adobedtm.com. Not sure why it happens, but I guess that Charles separates the requests from the browser that are transparently forwarded from the mapped requests.

To me, the most important attribute of this feature is that you do not need to have any browser extension. It will work with all browsers and, as we will see in a future post, with mobile devices too!
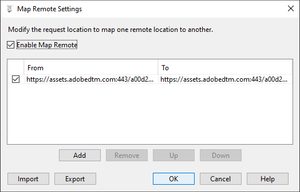
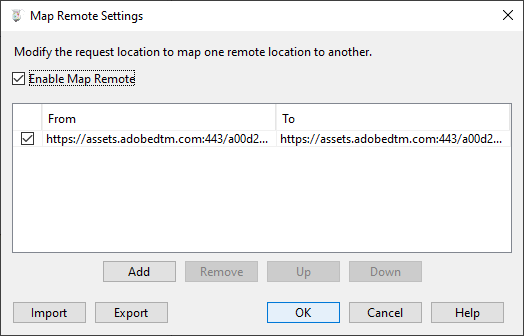
I know that this process seems long and tedious, but you only need to do it once. Charles will store the mapping internally and will load it every time you run it. However, once you have finished your debugging, you will want to have the correct Launch environment. To change the remote mapping configuration, you need to go to the menu Tools > Map Remote…:
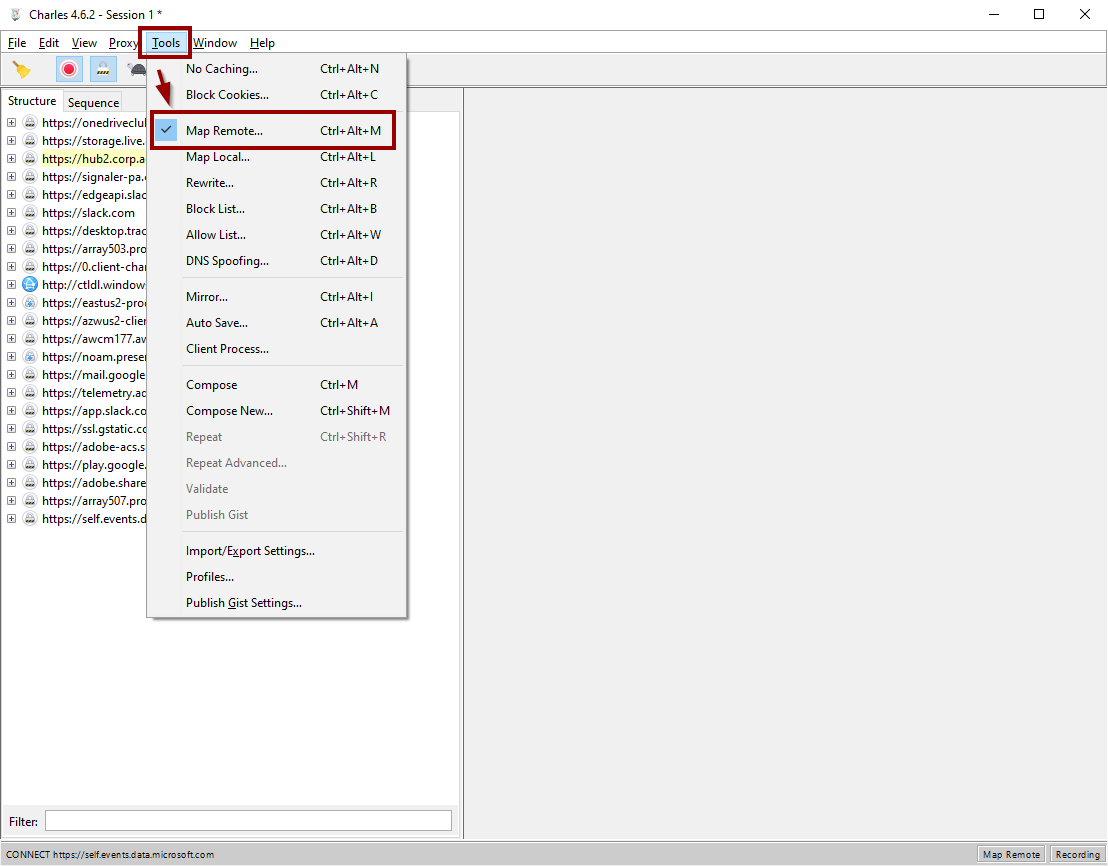
In this new dialogue, you can:
- Add new mapping rules directly
- Edit a rule
- Remove rules
- Reorder them (the feature supports wildcards and you may need to put them in the right order)
- Disable a single rule, by clicking on the checkbox next to it
- Disable the whole functionality by clicking on the checkbox “Enable Map Remote”