The Adobe Experience Platform Debugger
06 Jun 2021 » Analytics Tips
Every time I check the Adobe Analytics reports of this blog, the most visited post is How to debug an Adobe Analytics implementation. That post was written back in 2016 and, in technology, 5 years is an eternity. More importantly, one of my recommendations does not exist anymore. It is time to update that post and to talk about the successor of the Adobe Debugger: the Adobe Experience Platform (AEP) Debugger.
Before I forget, I wanted to clarify that both Charles and the browser developer tools are still great options. In my day-to-day job, when I have to debug an implementation of any Adobe tool, I always start with the latter. In my other post, I explicitly mentioned Chrome, but (I believe) all browsers based on Webkit should also have the same set of tools. Next, if the browser is not enough, I use the AEP Debugger. Finally, when things get really complicated or advanced, Charles is there to save the day.
Installation
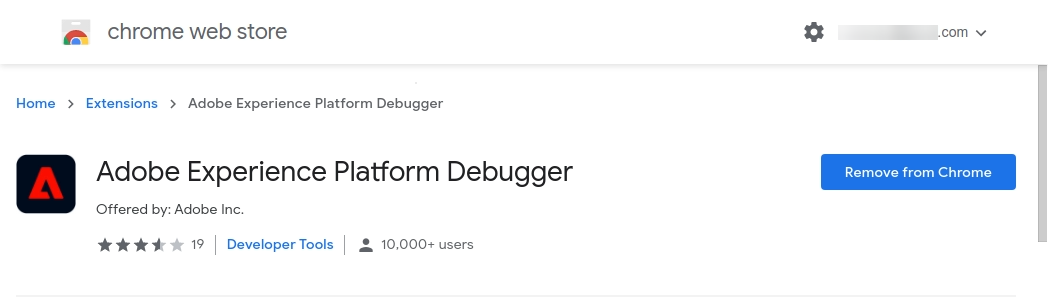
Although it is called Adobe Experience Platform Debugger, it also supports the Adobe Experience Cloud solutions: Adobe Analytics, Adobe Target, Adobe Audience Manager, Launch and the ECID service. You have to install the AEP Debugger from the Chrome Web Store.
User Interface
If you click on the extension button, a pop-up window shows up, with this interface:
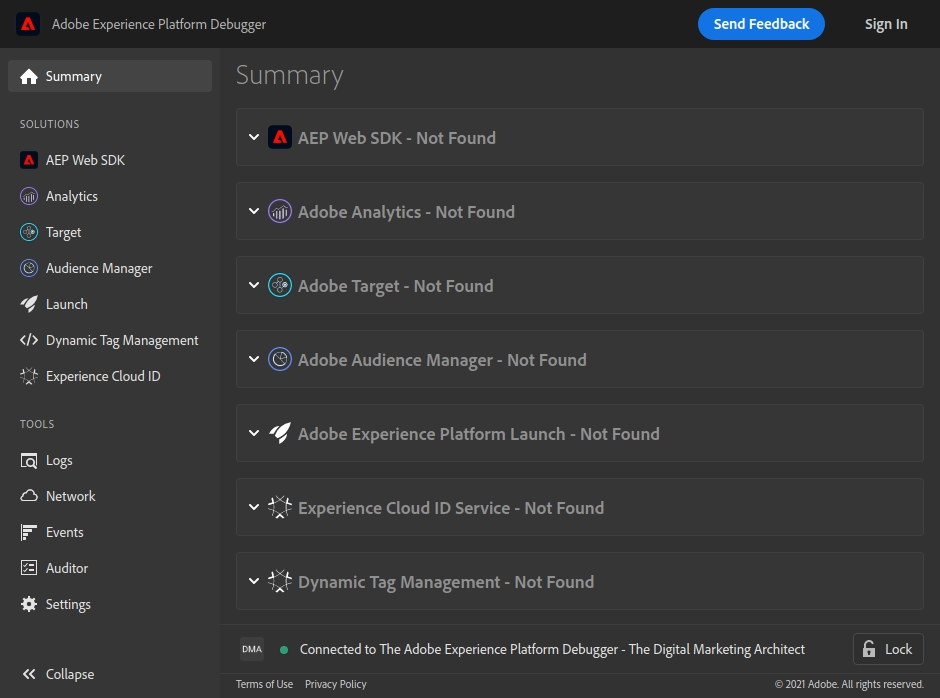
As you can see, unlike the old Adobe Debugger, the AEP Debugger supports all Adobe client-side libraries: Web SDK, Analytics, Target, Audience Manager, Launch/DTM and the ECID service. You may be surprised that it shows nothing, even when you are on a page with Adobe Analytics. However, this is the expected behaviour. Just refresh the web page (not the extension page, which you should keep open) to force the extension to connect to the page:
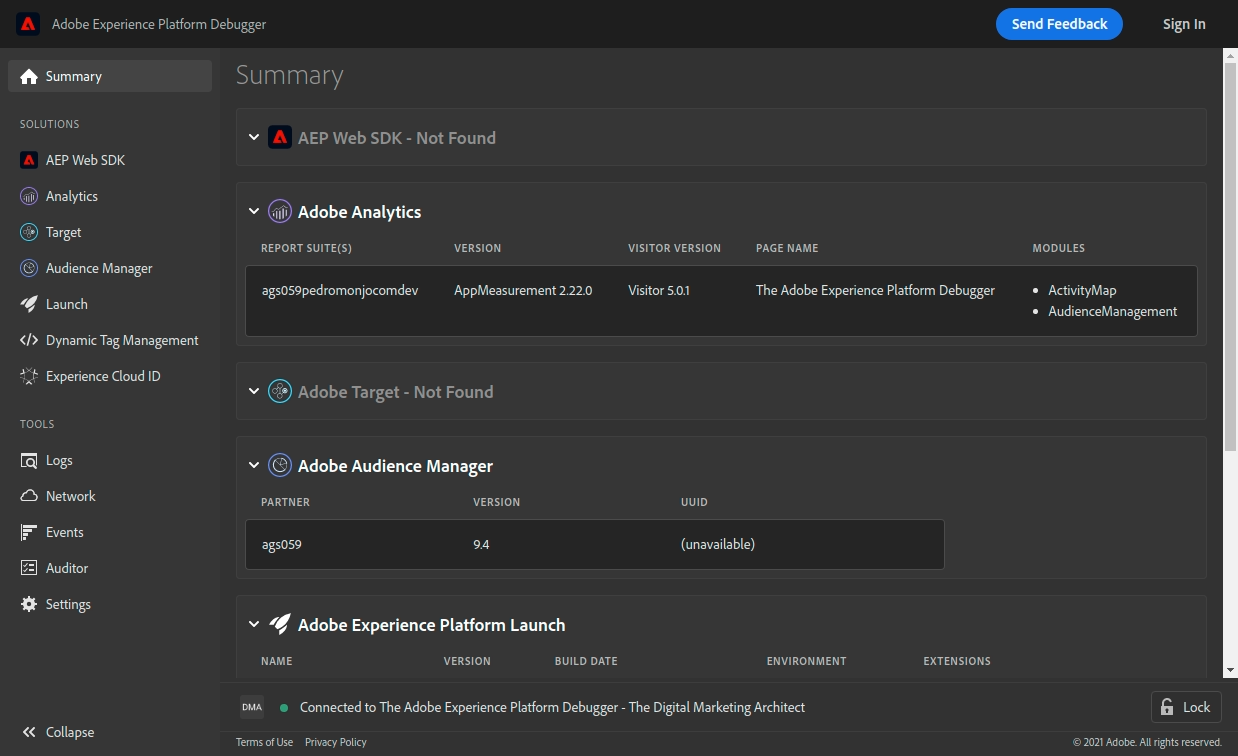
Solutions
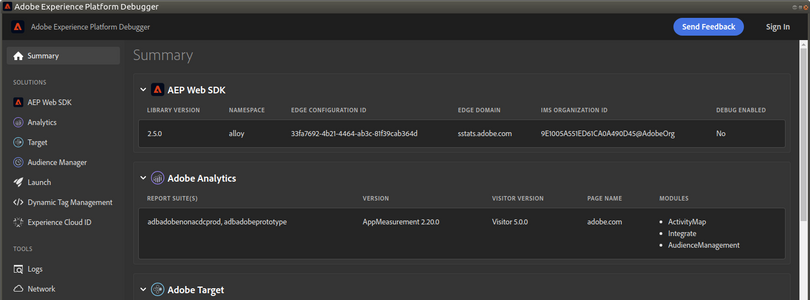
The previous screenshot is from the summary page. However, you will probably want to analyse in more detail each of the tools. Just click on any solution from the left menu and you will get more details. In the case of Adobe Analytics, you will see the decoded data from the server calls. If you keep the debugger open and navigate to other pages, you will see that the debugger keeps the log of the calls. To me, these are clear benefits of this debugger compared to the browser developer tools:
- If focus only on the Adobe tools; no need to apply filters.
- It decodes the data using friendly names.
- It keeps the logs by default.
- In the case of Analytics, it supports both GET and POST image requests.
For example, in Adobe Analytics after visiting 2 pages, you would see:
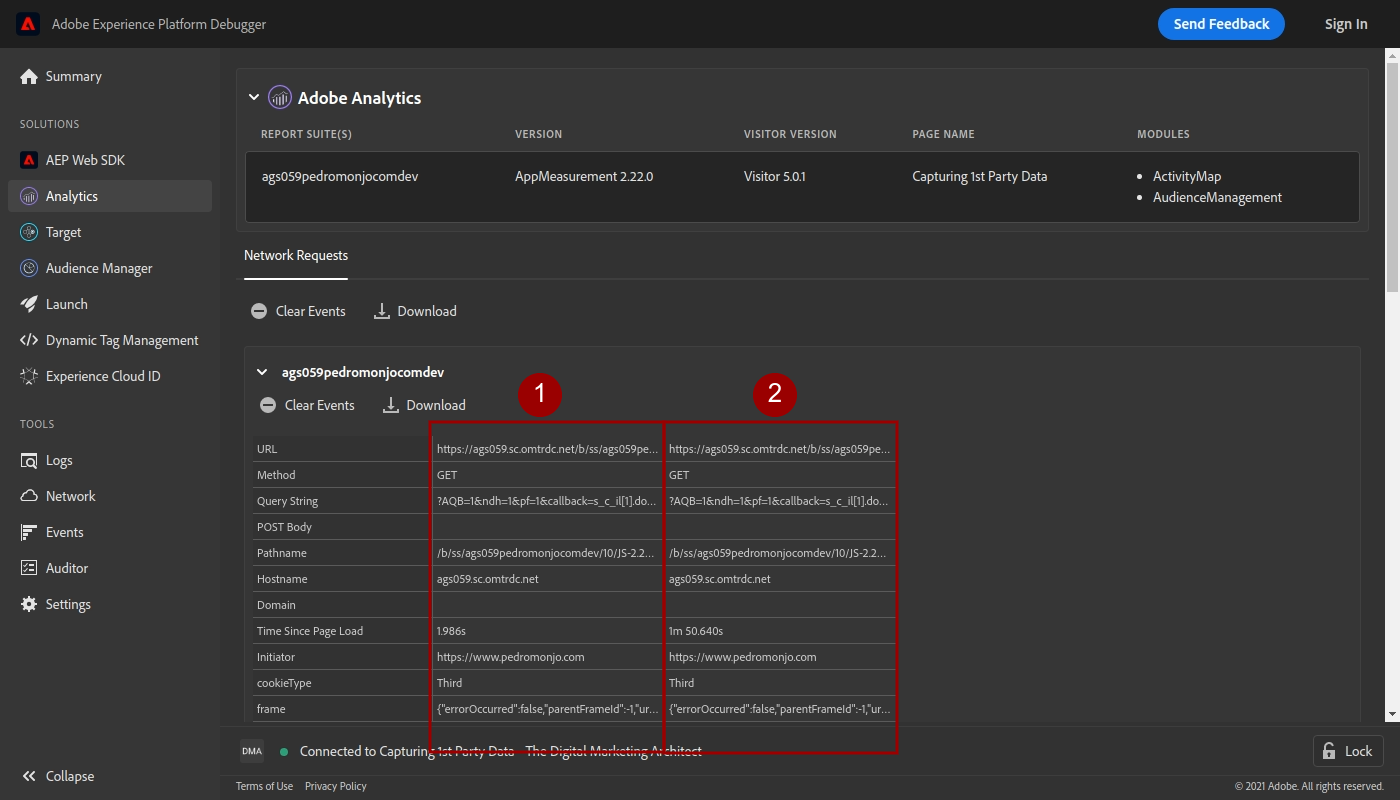
I will not explain here all the features that the debugger offers for each solution. They are pretty obvious in most cases. I would just encourage you to explore and click on the different options.
Tools
The AEC debugger offers a few additional tools, generic for all solutions. From these tools, I would highlight 2:
-
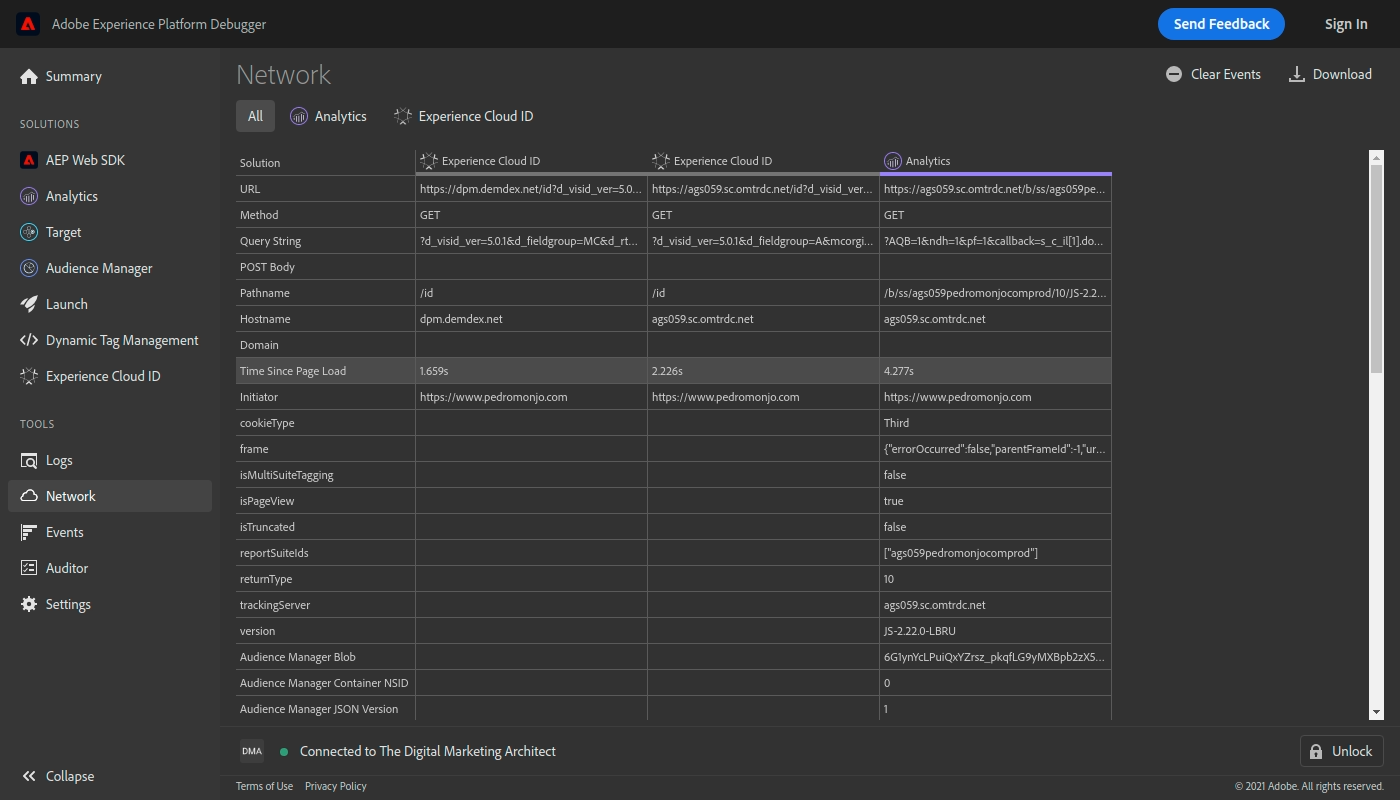
Network. This is a summary of all the calls made to Adobe tools. Instead of having to filter by
b/ssfor Analytics calls ordpm.demdex.netfor ECID and AAM calls, the debugger extracts them for you and consolidates them in a single screen:
-
Events. There is one piece of useful information that the previous tool does not offer: timing. The Events fills this gap: it shows the times when the different calls were made:

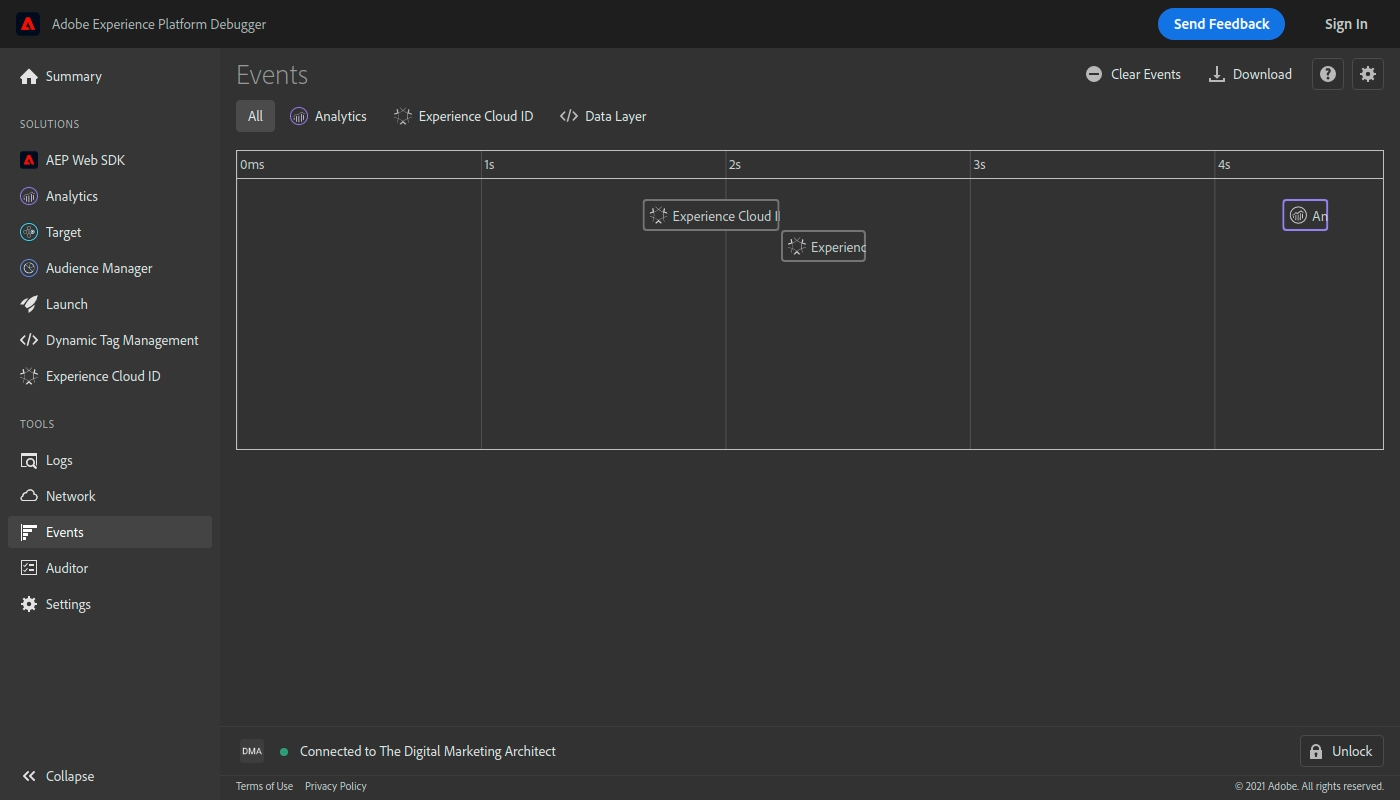
They offer some details that the browser developer tools offer, again, applied to Adobe solutions.
Locking
One “annoying” feature of the AEP debugger is that it follows you as you interact with the browser. As long as you keep the window open, the debugger will show the debugging information from the active tab. I find it quite confusing, as I would expect it to stick to the tab I had selected when invoking the debugger.
If you want the debugger to just focus on one tab, while you move back and forth in the browser, you must lock the debugger. Just go back to the desired tab and click on the “Lock” button on the bottom-right corner of the debugger. You will then see that the lock is now closed and you are free to play with the browser while keeping the content of the debugger stable. Clicking on the button again will unlock the debugger.
Logging in
You may have also noticed that at the top-right corner of the debugger there is a “Sign In” link. If you log in with your Adobe ID credentials, the debugger offers additional features. So far, I have only identified 2.
The first one is the case of Auditor. I assume that it connects to your AEC Auditor instance. However, I have to admit I have never used it.
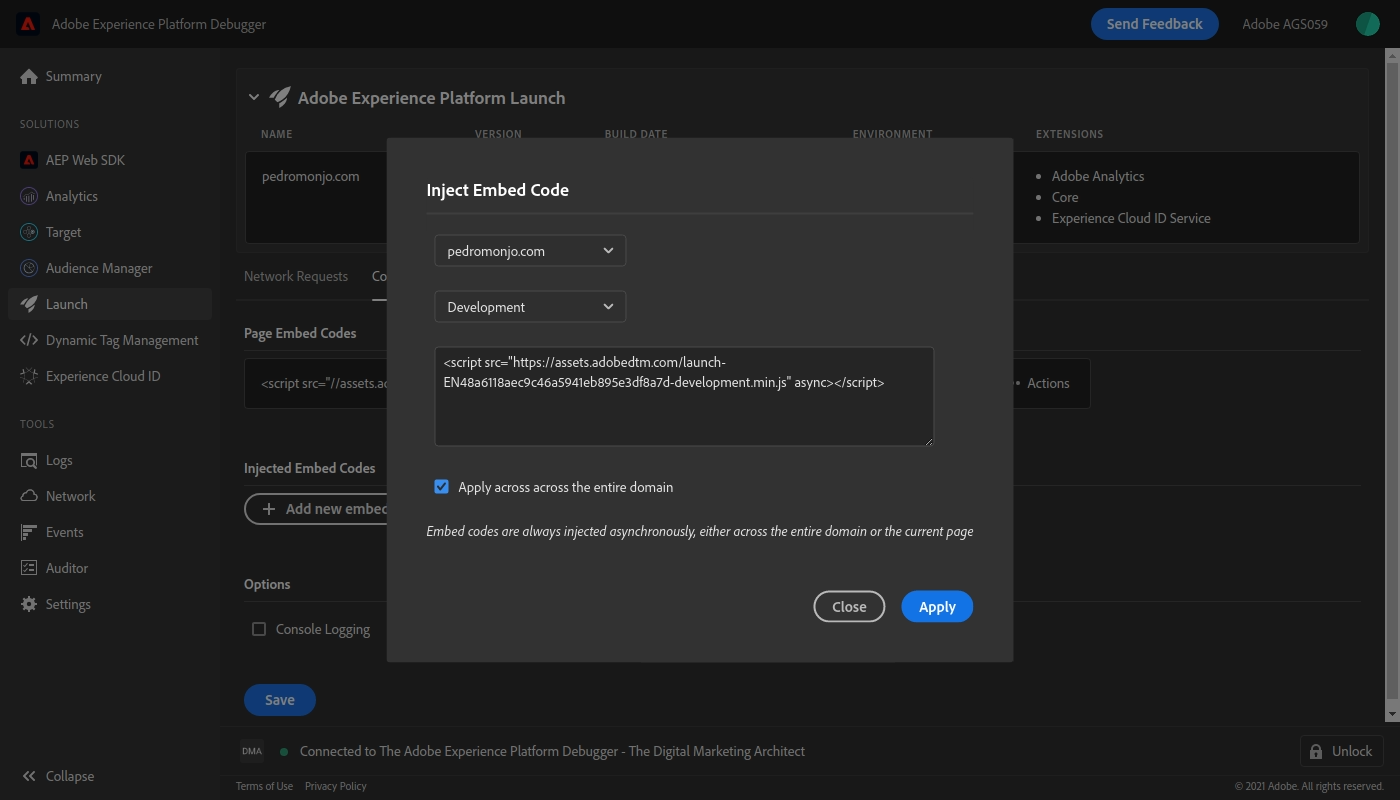
The other one is the more interesting. Under Launch, it adds the capability of injecting embed codes, to debug unpublished libraries.
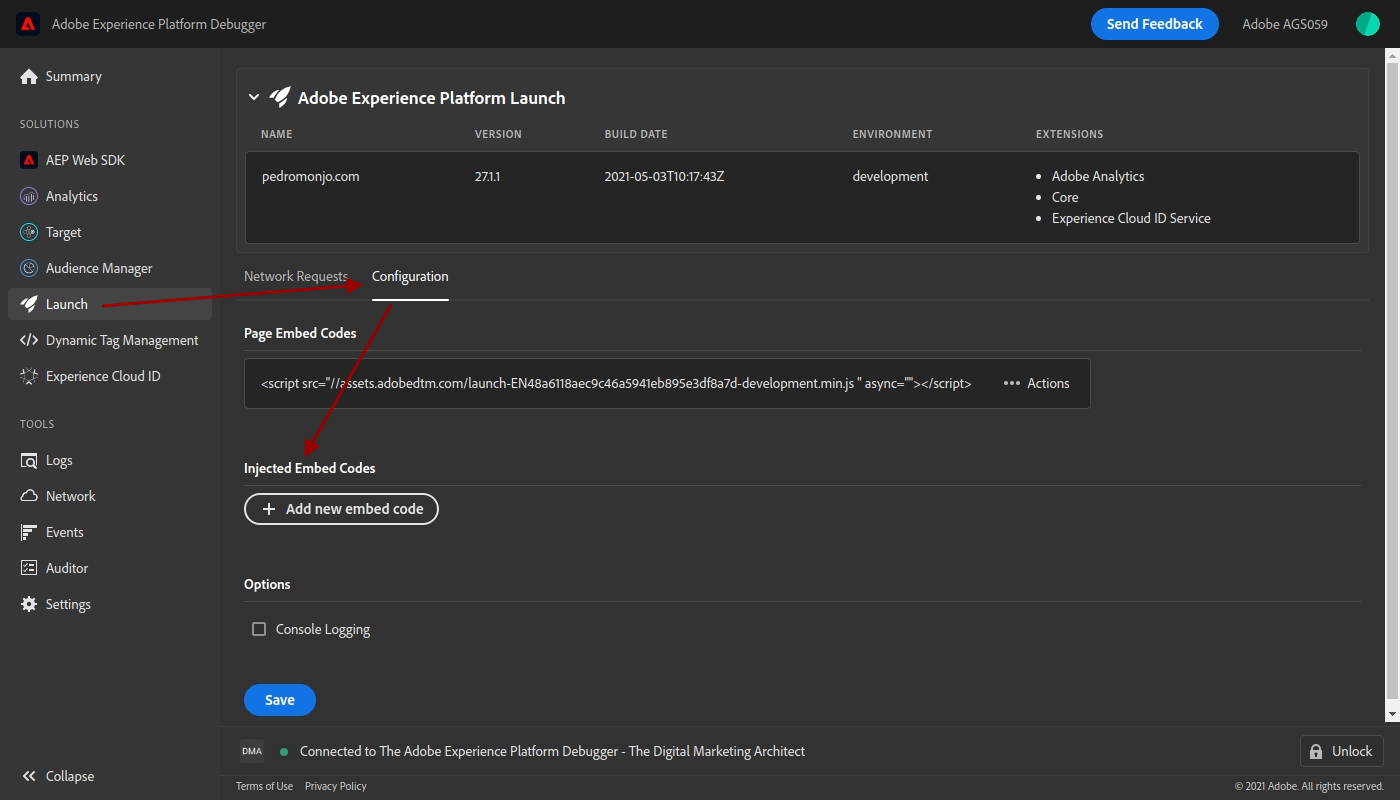
After clicking on “+ Add new embed code”, an overlay will appear and the debugger will connect to the Launch API to retrieve its configuration. From there, you can choose the property and environment:
And that is all I wanted to explain for today. Unless you need to do some complex debugging with Charles, I recommend that you use the AEP debugger for all your needs from now on. Let me know in the comments if you would like me to explain in more depth any other feature.