
Fundamentals of Dimensions and Metrics
11 Oct 2020 » Analytics Tips
When I started working with Adobe Analytics almost 10 years ago, before I joined Adobe, nobody explained me some web analytics basics. People mentioned concepts like dimensions and metrics and, initially, I did not understand them. In this post I will explain how I visualise these concepts, which helped me understand them. It may help you if you are in a similar situation or you see others having trouble grasping them.
Dimensions
Usually, the first concept that comes to mind when we think in dimensions is the world we live in, which is a 3-dimensional world. This comes natural to us, so natural that we rarely think about it. We have up/down, left/right and front/back. In mathematical or physical terms, we often refer to this as the X, Y & Z axis:

Given a reference point (the centre for the 3 axis), we can define exactly where each point in the world is. For example, taking my mouse as the reference, the centre of my screen is 40 cm to the left, 40 cm to the front and 20 cm up. (If you have a degree in physics you would say that we live in a 4-dimensional world and if you have a PhD in string theory, you would argue that there are actually 10 or 11 dimensions, but let’s keep it simple for now 😉)
We can also make simplifications and think in 1 or 2 dimensions. Your computer screen or a piece of paper are 2-dimensional: you can only move up/down and left/right, there is no depth.
Metrics
Now let’s take the next step. Consider that, for each point in space, you assign a numeric value, for example, temperature or weight. In other words, for whatever coordinates you choose, there is a value that has some meaning to you. This is what we call a metric. In the example of the temperature, you could put a thermometer and see what it measures. In the room you are, all points in the air will be at, maybe, 25°C, but points in your body will be at around 37°C.
You can also do that in a 1- and 2-dimensional worlds, which opens up new possibilities in representation. Since you only have 1 or 2 dimensions, X or X & Y, but our brain can use 3 dimension, we can use an extra dimension to show metrics. To make it more visual, consider something like this:
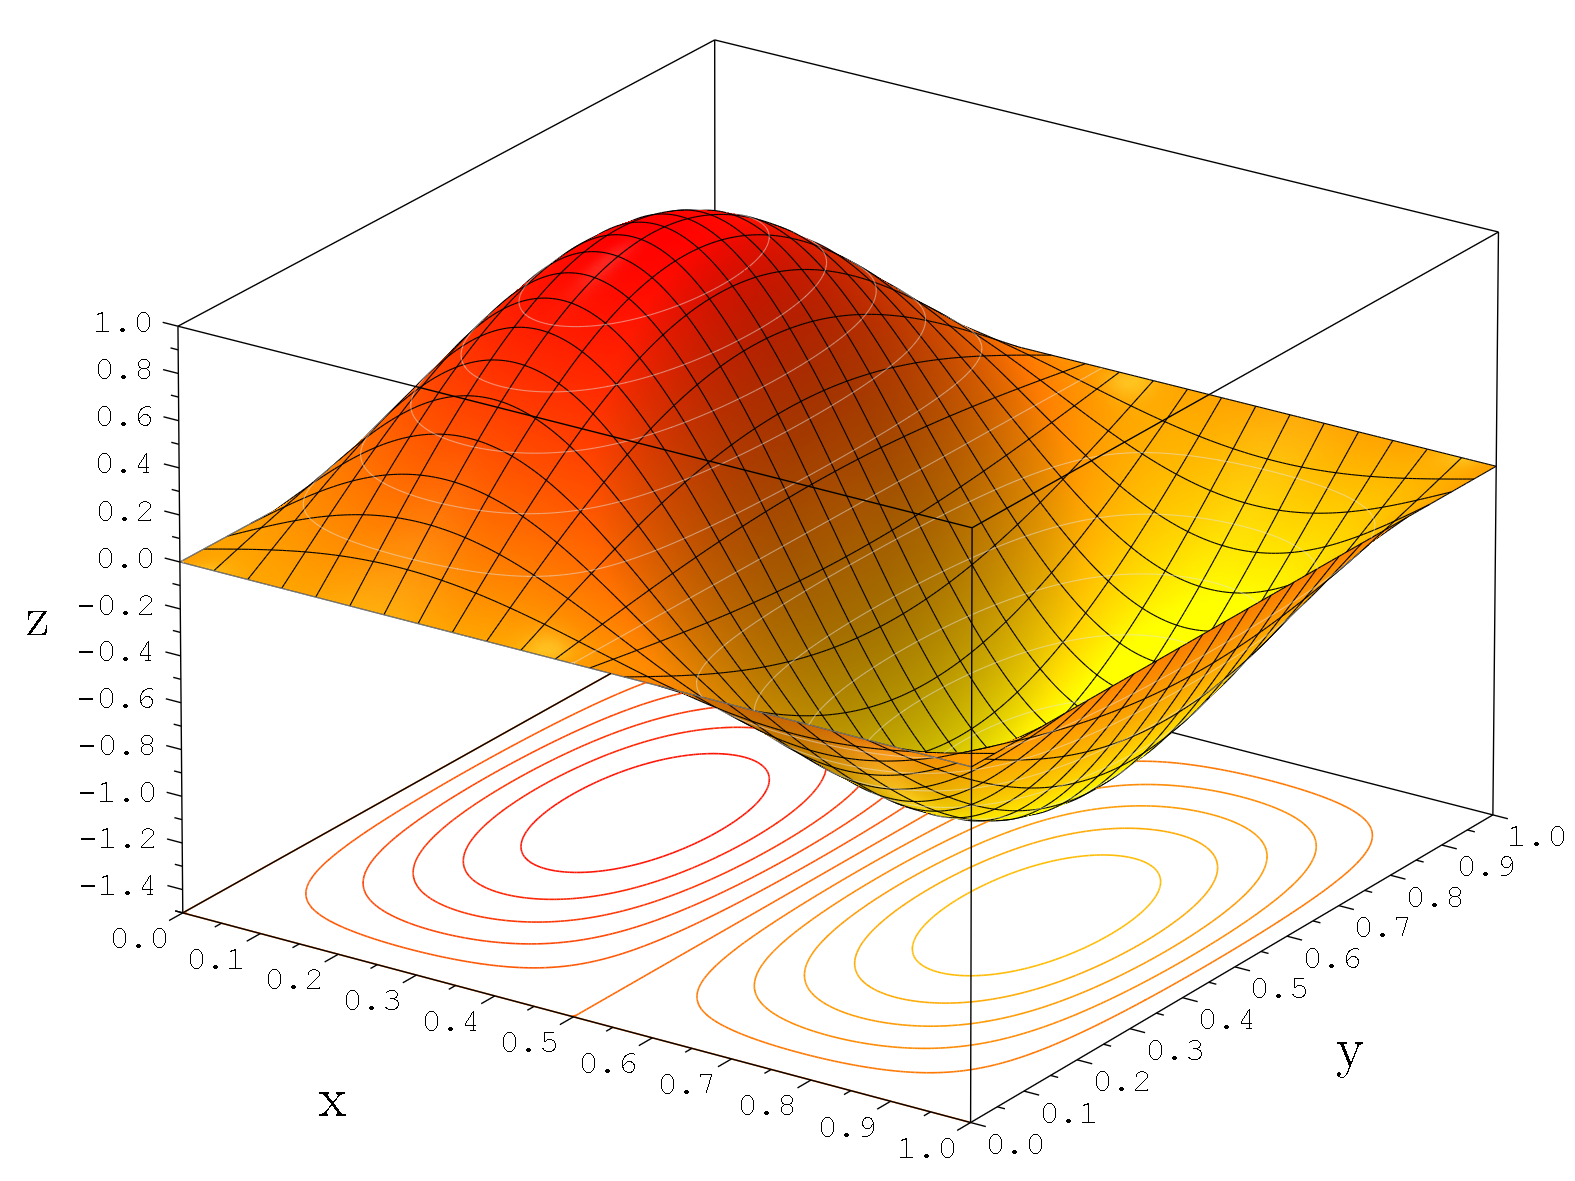
For x=0.3 and y=0.5, your metric is z=1; for x=0.5, irrespective of y, your metric is z=0. Remember, here, the Z axis is not a dimension, but a representation of your metric.
Histograms
We have considered that a dimension is a distance from a central point. We can extend this concept to a list of values that are related, for example, colours. In this case, there is typically only one dimension, but we could extend it to two dimensions to, like: x=colour; y=darkness. Continuing with the colours, I can create a random metric: popularity of a colour in a nursery class. What is important is that the metric is always a number.
If I only have one dimension, which is a list of values, and one metric and I represent it, I get a histogram.
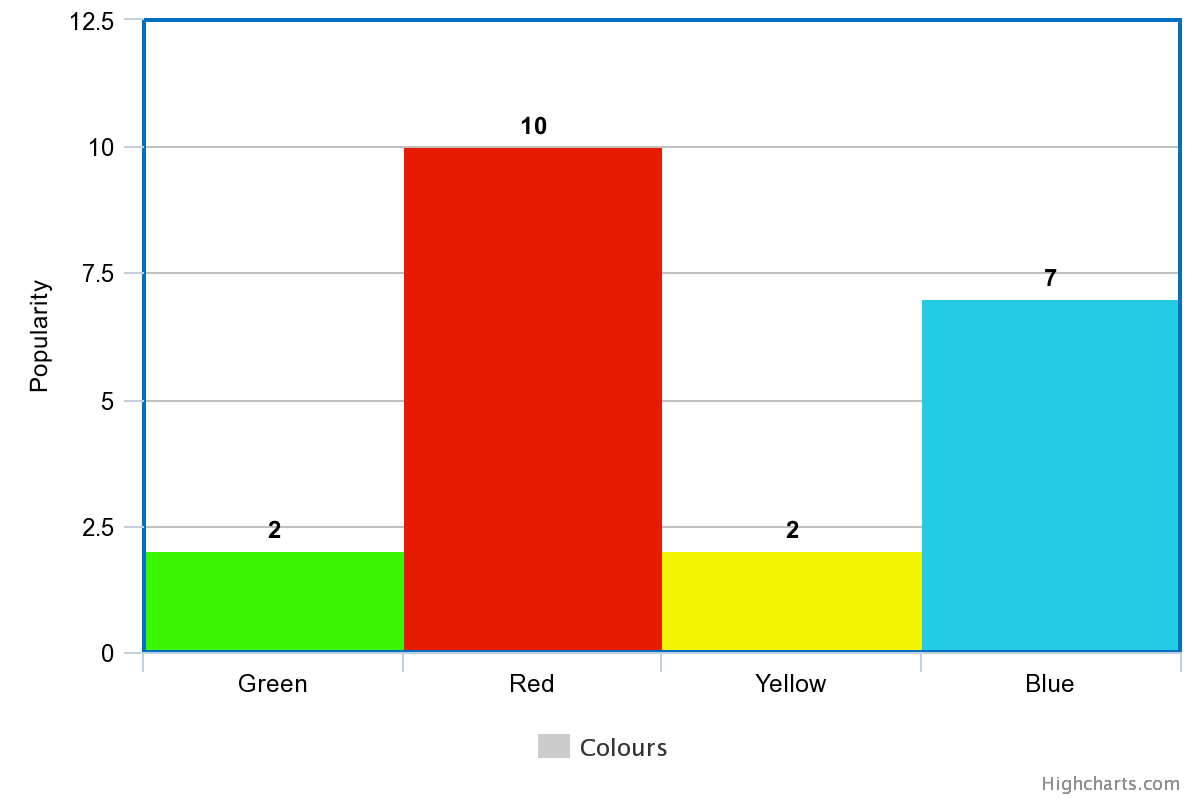
| Colour | Populatiry |
|---|---|
| Green | 2 |
| Red | 10 |
| Yellow | 2 |
| Blue | 7 |
Even if it looks different from the diagrams above, in essence we have the same:
- X-axis (dimension): colours
- Y-axis (metric): popularity
Web analytics
Now that I have set the scene, I can move to our realm: web analytics. I can apply all that I have mentioned before to web analytics:
- Typical dimensions: page names, products, marketing channel, web section, URL…
- Typical metrics: page view, visits, visitors, purchases, revenue…
As I explained with histograms, dimensions are a list of related values and metrics are always numbers. Take the following graph as an example. It is one of the most basics reports, but it shows what I want:
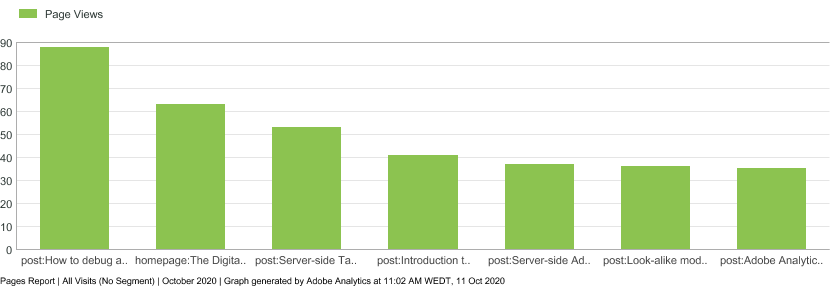
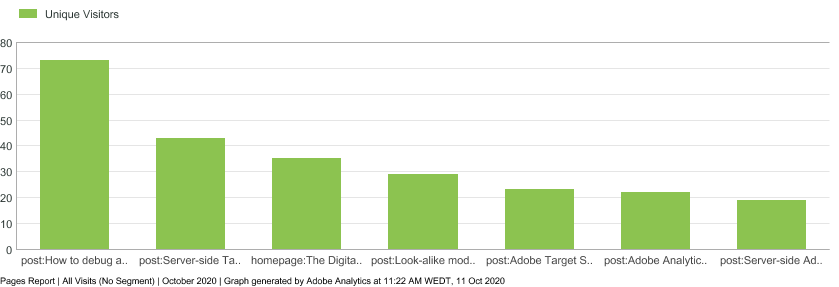
My dimension is in the X-axis, which is a list of values instead of a number; in this case, the most popular pages of my blog. The metric I have chosen is page views, it is in the Y-axis and, as always, it is a number. Instead of page views, I could use any other metric, like visitors, and get a new representation:
If you think about it, web analytics is all about mixing dimensions and metrics and making sense of it. For example, it makes a lot of sense to see which products (dimension) are mostly purchased (metric); however, the page (dimension) where you make most of your revenue (metric) will be the order confirmation page, something you already knew and does not give you much information.
I hope that, by now, you are able not only to talk about metrics and dimensions, but you can also picture them in your mind and can explain to a newbie how to understand them. In my next post I will explain how Adobe Analytics understands metrics and dimensions.
Photo by Mat Reding on Pexels