
Real-Time Reports
02 Sep 2018 » Analytics Tips
Today I am going to explain one of those features you rarely use, but it can be very useful in certain circumstances: real-time reports in Adobe Analytics. As its name implies, with this feature you can get certain reports in real-time.
Origin of real-time reports
For those of you who have been working with Adobe Analytics for a while, you will remember that SiteCatalyst 14 was near real-time. When SiteCatalyst 15 was released, it had a lot of great new features. However, it came with a small drawback: it requires around 90 minutes to process the reports. This new platform is the foundation of Adobe Analytics as we know it today and has allowed for great features, so probably this limitation is a good compromise. In my opinion. web analytics is a retrospective analysis, but there are always anxious web analysts or managers who want data sooner.
The first step towards this goal was a feature named “current data”. These were near real-time reports of some metrics and dimensions. Only basic metrics and props support this feature and it is only available in the classic “Reports” UI.
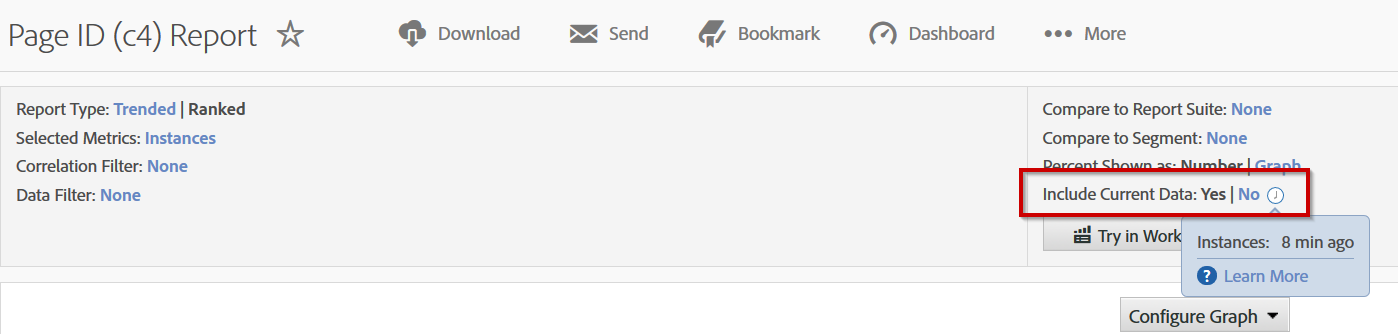
By hovering of the the small (i) icon, you get when the metrics were last updated. Still, this was not enough and Adobe created a new solution: real-time reports.
Limitations
Before we dive into how to use them, you need to know what are the limitations of these reports and, most importantly, why:
- You can only set 3 of them, per report suite.
- Only basic events and props are available. The reason is because eVars attribution, visits, visitors and other dimensions and metrics require some more complex processing and, therefore, have been excluded.
- The UI is very simple, but, since there are not many options anyway, it should be enough for most of the uses. If you want to embed these reports elsewhere, you can always use the API.
- The metrics are a few seconds behind the actual activity, although I doubt these reports could be faster or that any speed increase would cause any benefits.
Configuration
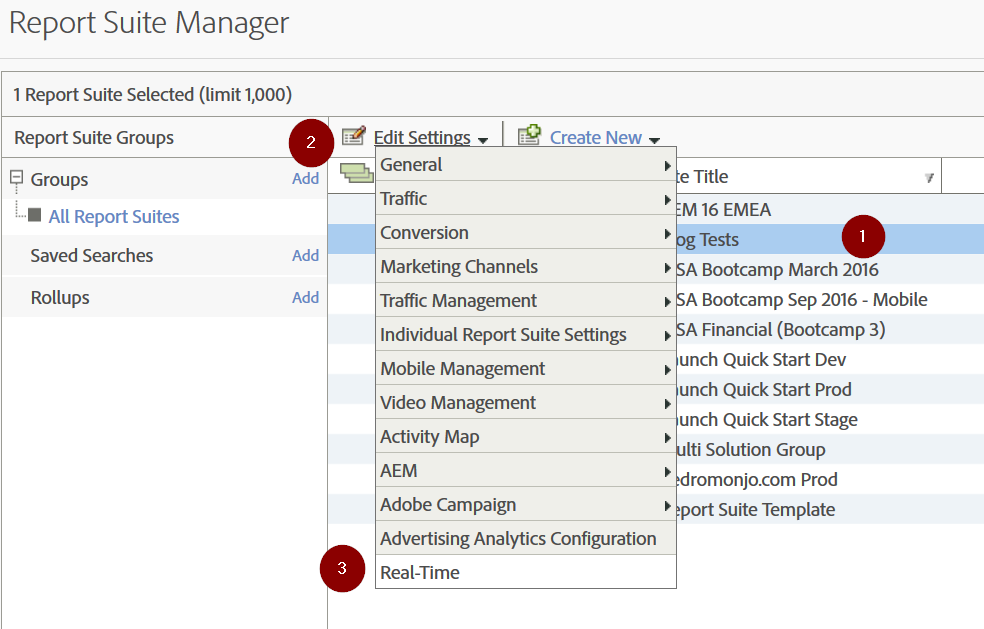
The configuration of real-time reports is quite different from the typical reports. For starters, you need to be an admin and go to the report suites admin section. Then:
- Select the report suite from the list
- Click on “Edit Settings”
- Click on “Real-Time” at the bottom of the menu
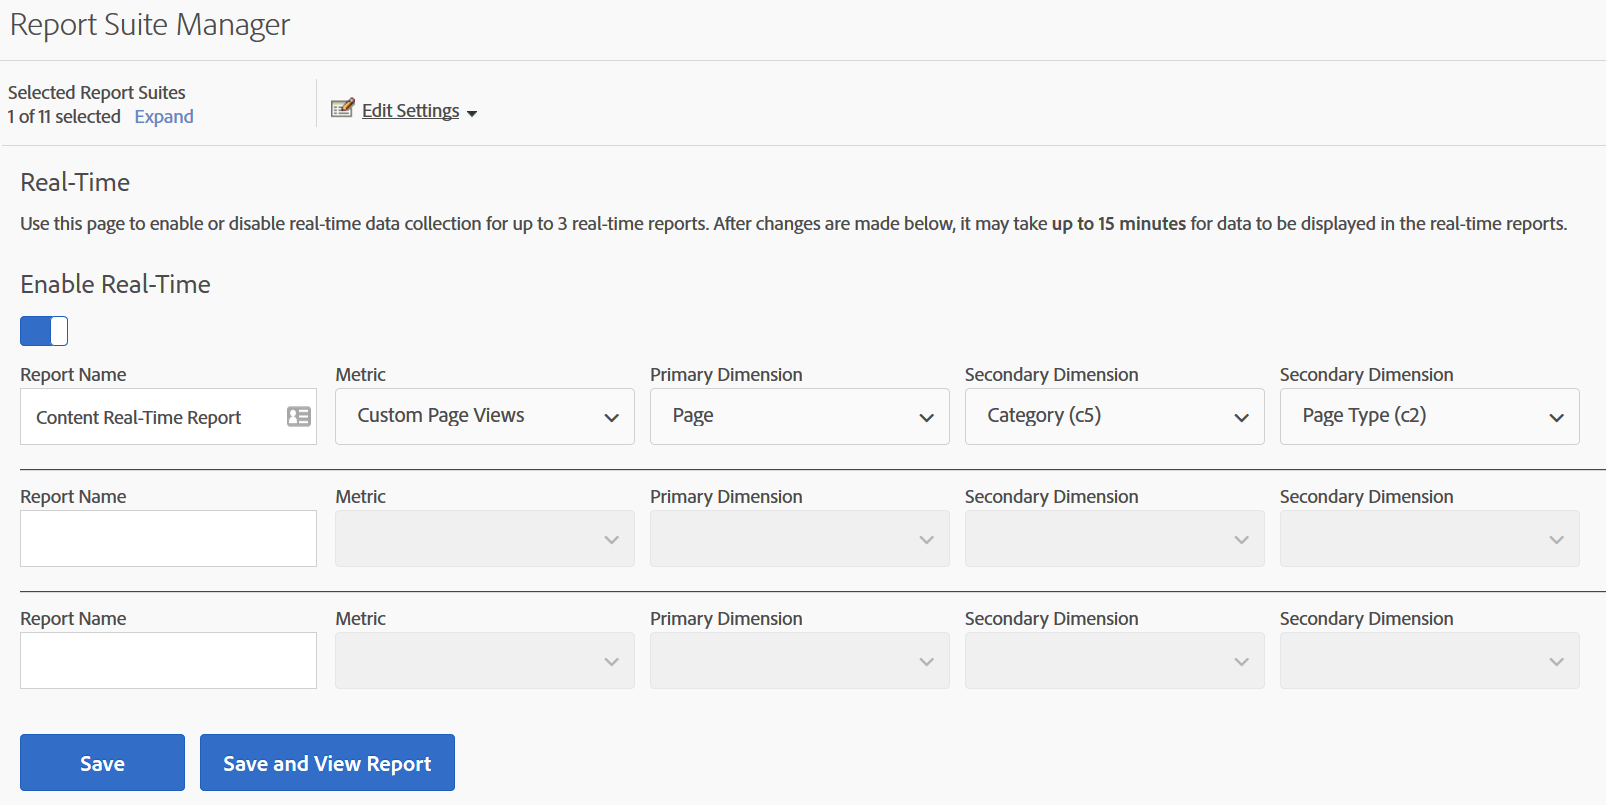
The first time you get to the configuration screen, you have to enable the feature. Below the switch, you have the list of 3 real-time reports available for the report suite. There are 5 parameters you need to configure for each: the report name, the metric (only one), a primary dimension and 2 secondary dimensions. The metric is an event, so, if you want to use page views, you will need to create a custom event for it. The dimensions are traffic variables. Once you finish, click on “Save” or “Save and View Report” if you want to go directly to the reports.
Accessing the reports in the UI
You can only access these reports in the traditional “Reports” interface.
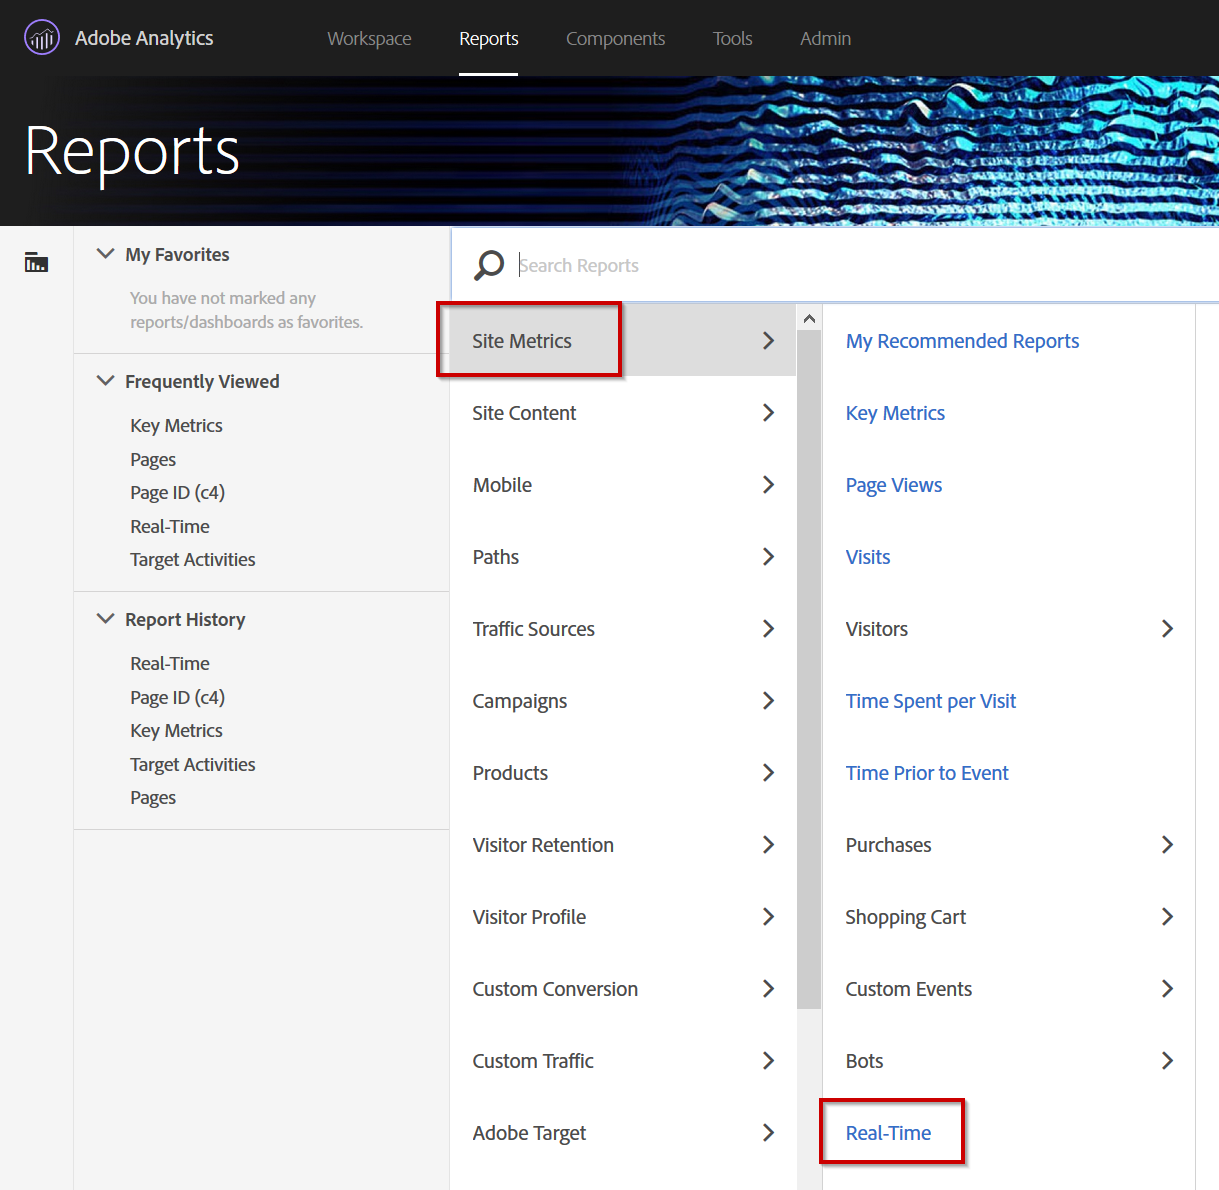
Once you are there, you see the first of three report:
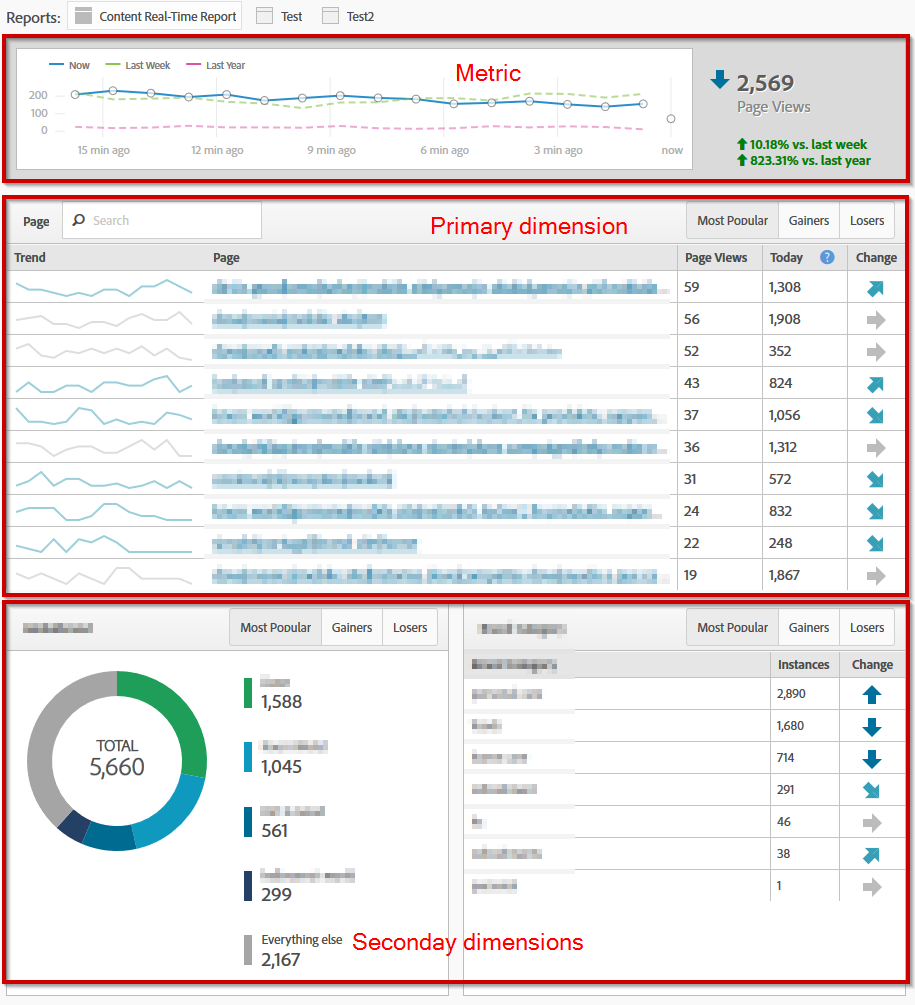
Now you see what happens with your choices of metric, primary dimension and secondary dimensions. So, if they do not match what you are looking for, go back to the configuration page and amend it.
There are a couple of interesting features in this report:
- It refreshes every few seconds, so you can see the changes in almost real-time. Remember there is a small delay, in the range of seconds.
- It shows how the top values of the dimensions go up (gainers) and down (losers)
- All of them together (most popular)
- Only gainers and only losers
Yes, that’s it! It is very simple, no complex settings.
Do you use real-time reports? What for?