
Incrementality
26 Nov 2023 » Opinion
Ever since I had my first statistics lesson in high school, I have hated the subject. All I can really understand is that each side of an unloaded dice has a probability of 1/6. Other, more complex concepts like stochastic processes are just black magic to me. Unfortunately for me, there is one area of digital marketing that requires a good knowledge of statistics: the measure of incrementality. I do not claim to be an expert, but I more or less understand the important concept behind it. I will do my best to explain it in this post, although this is more for me to keep track of something I have learned.
To do or not to do
Let’s begin our story with what I will call the CMO’s dilemma. If I put myself in the shoes of a CMO and I had to invest in a new technology or process, among other things, I would want to get a clear picture of:
- Return on investment (ROI). This is the obvious one, if I invest in something, I expect to get more from it than what I spent on it. Otherwise, I would keep the money in the bank for other investments.
- Incrementality. Even if I forecasted a positive ROI within a year or two, I want this new technology or process to drive more revenue than my existing process or technology. Again, if I do not get anything new, I will want to invest the money elsewhere. For example, in a past engagement I had, my customer purchased Adobe Journey Optimizer (AJO) and wanted to compare the outcome of using journeys with the outcome of their blast campaigns.
The issue? Marketing is not an exact science, it is based on statistics. In other words, there is no magic formula to irrefutably tell you whether one technology is driving more sales than another technology.
Attribution
The first problem that you need to solve is how to measure the influence of your marketing activities on sales or revenue. I have written a couple of times about the concept of attribution: Some Thoughts on Attribution and Adobe Analytics Attribution IQ. There are many ways to calculate attribution and each one renders a different result. Some people will claim that ML models are the best, and they are probably right, but we need to remember that they are just approximations, good approximations. How can you be 100% sure that a Facebook ad shown 2 weeks ago influenced the purchase of your product today?
There is a bigger problem with attribution: the fear of changing the algorithm. Many companies, even when they know that their existing attribution algorithm is inaccurate and they have found a better one, do not want to change it because bonuses and budget allocations depend on it. People are very sensitive to seeing their salaries go down. As a consequence, the values that senior managers get are not always accurate.
Treatment, control, and holdout groups
Before I continue, I need to explain some terms. I have to admit that I had only started hearing them for the first time this year. It is not that I did not know about the concepts, it is just that my customers never gave them a name.
Going back to the CMO dilemma, the way to measure incrementality is to compare the revenue of the new technology with the current performance of the existing technology. To do so most accurately, you need to divide your customers or prospects into two groups:
- Treatment refers to the audience who is going to receive marketing campaigns using the new technology. I guess the term refers to the fact that the new technology is going to treat them.
- Control is the audience that is not going to be addressed with the new technology. This does not necessarily mean that they are not getting any marketing campaigns, they could receive messages from the old technology.
It goes without saying that these audiences are mutually exclusive. The idea is that the control group acts as a baseline and the treatment group is expected to perform better. This process is nothing new; clinical trials do the same.
The process to create this divide is to build an audience that will serve as a control, which we call a holdout group. You will see that holdout group and control are almost synonyms. There may be a small difference between the two, but I cannot tell. If you have a better explanation, let me know in the comments.
There are a few ways to create this holdout group:
- Using a random number generator. You need to make sure that a customer only gets evaluated once. If the generation is periodic, you may have customers receiving inconsistent messaging, as they will sometimes fall into the treatment group, and sometimes into the control group. For example, AJO offers the condition activity with a percentage split.
- Using profile attributes, like location, gender, name… You then choose the people who have a first name starting with some letters, or people living in some areas of the country. In general, this may not be a good idea, as there could be differences in behavior depending on these parameters. However, it is sometimes the only way to create a holdout group.
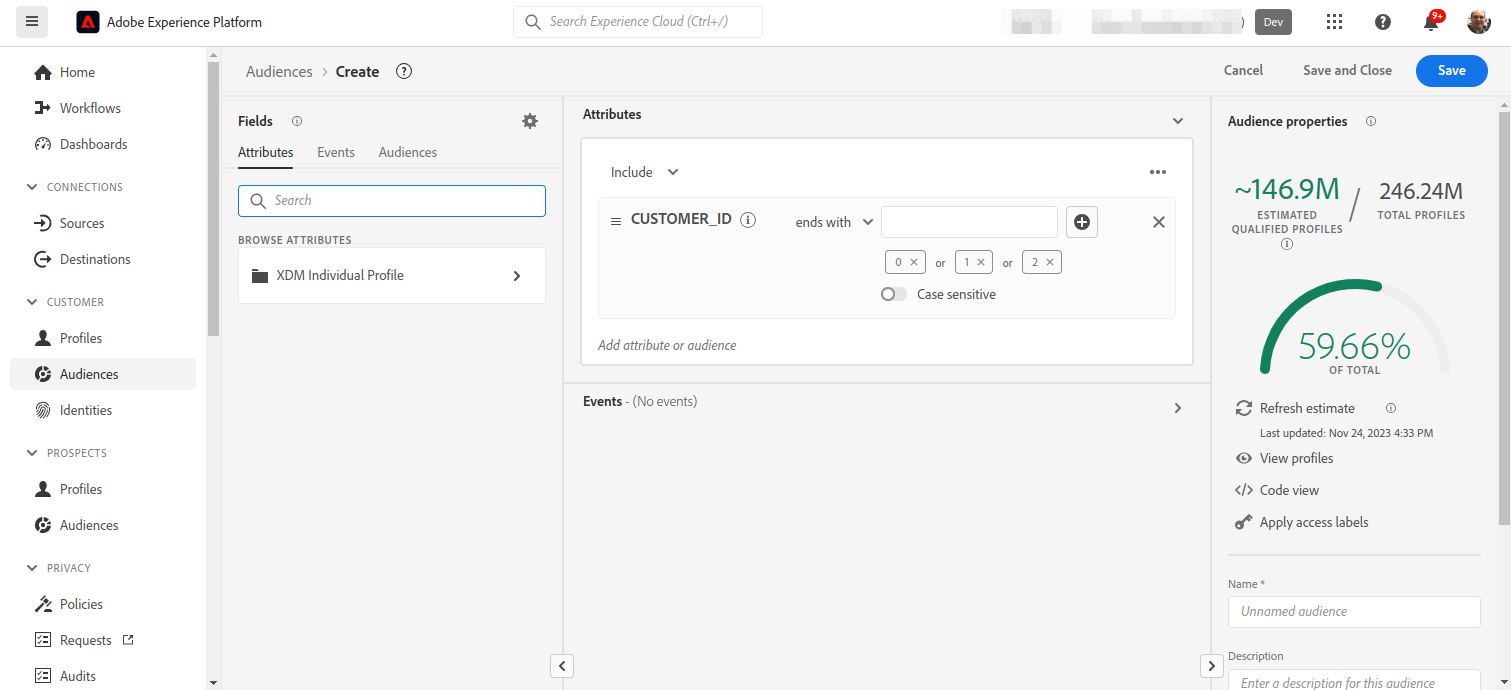
- Using an ID. If you have a CRM ID, you can look at the last few characters of the ID. RTCDP supports the “ends with” condition. Obviously, you should confirm that the CRM ID generator is random.
There are many approaches to managing this holdout group. Before you create it, you need to answer some questions:
- Should you create a new holdout group for each of your experiments? Or should you create a universal holdout group for all your activities?
- Which algorithm should you use to create it?
- How big should it be?
- How often should you refresh it?
Lift & confidence
Once you have the two previous audiences, you run a campaign for the treatment group using the new technology only. The control group must be completely excluded from the campaign. This is exactly an A/B test in case you were wondering.
The next thing that you will want is to evaluate the lift and the confidence that the treatment group shows compared to the control group. I do not have a great definition for these terms, they are statistical terms that elude me. However, I can explain at a high level what they refer to:
- Lift. This metric more or less shows the additional conversions or revenue generated by the treatment compared to the control. You want it to be positive and as high as possible. It can be negative, which means that the treatment group is performing worse than the control, i.e., the new technology or process is not a good investment.
- Confidence. Since lift is a statistical value, by its nature, it is not exact. You then need to check the confidence, which tells you how accurate the lift is. It is also a percentage and you should aim at confidence greater than 90%, the higher the better.
If you have used Adobe Target, this is old knowledge for you and probably know more than me. Feel free to correct me in the comments. For those of you who have been using the Adobe Experience Cloud for a while, the whole point of Analytics for Target (A4T) was to bring these two metrics from Adobe Target to Adobe Analytics. If you want more details on how this tool calculates lift and confidence, you have this help page: Statistical calculations.
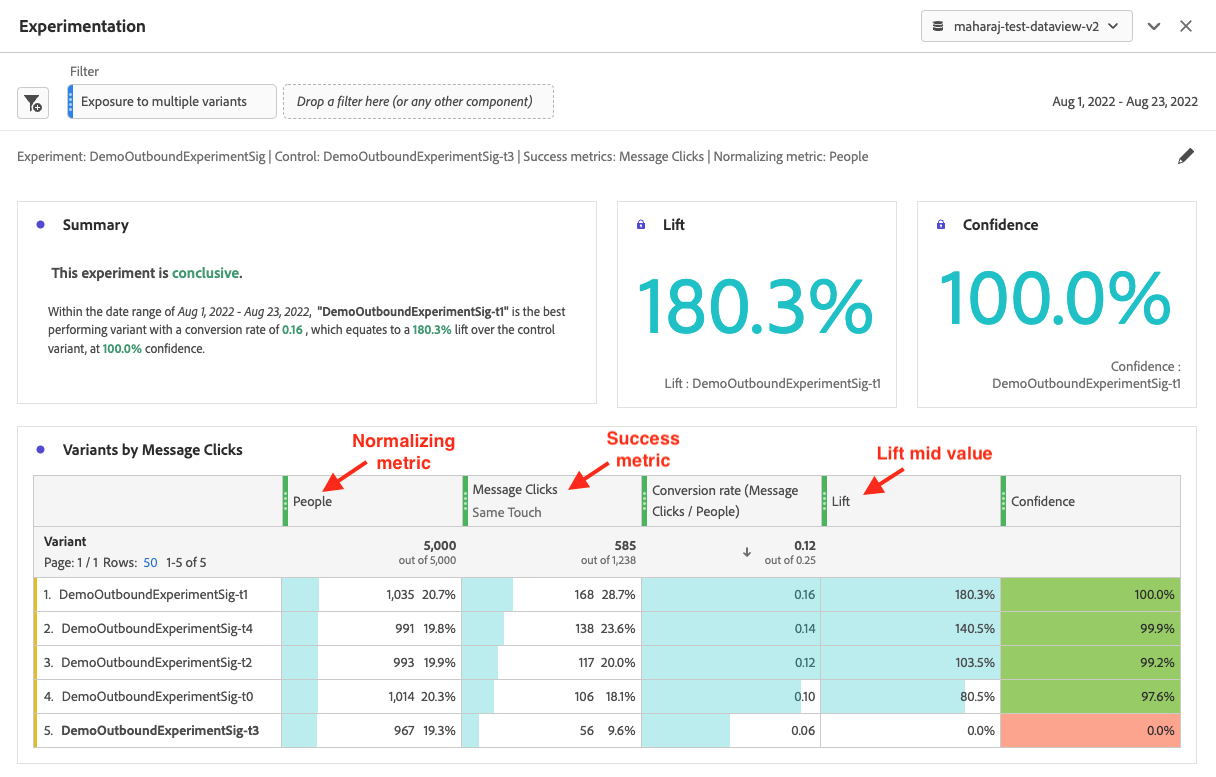
Customer Journey Analytics (CJA) has also the Experimentation Panel, which calculates lift and confidence for anything that you want, not just Adobe Target A/B tests. I find this a really cool feature, as you can finally do your calculations for any marketing activity, like AJO journeys, as long as you have the right data.
Final comments
Circling back to the CMO’s dilemma, I could do the following:
- Create a holdout group.
- Create a campaign with the new technology, excluding the holdout group.
- Calculate the attribution to this new technology of the conversions.
- Calculate the lift and confidence of the attributed part.
I should then be able to calculate incrementality, at least in theory. I want to stress these last two words: in theory. Many other factors may affect it and you need to take them into account. Usually, you will have to do some iterations until you reach a point where your personal confidence (not the statistical confidence from above) is enough to accept the results. Also, as I said at the very beginning, I am no expert on this topic and probably I have missed something. My goal was to show the overall idea.