
Debugging server-side implementations
09 Jul 2018 » MSA
We are all familiar with the client-side debugging tools, from the old DigitalPulse debugger to Charles. However, as Tim asked me some time ago, how do we debug server-side implementations? It is not always easy, but you have various options. Let’s explore them.
Access to the server
This is the ideal situation, which I would expect it is the case when you are in the implementation phase. I am not going to explain a lot for this situation, as it is straight forward. My recommendation is to use one of these two options:
- If possible, install Charles in the server itself
- Otherwise, set the HTTP proxy in the server to redirect all calls through your laptop/desktop
If you are using HTTPS (as you should), you will need to install the Charles certificates in your server, so the server trusts Charles.
For the rest of this post, I am going to assume you do not have access to the server. You can only make requests to the server administrator, who will do some tasks for you.
Logging
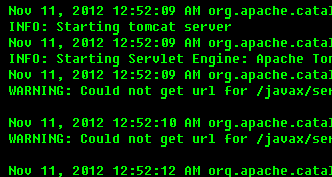 Yes, I know, I must have burnt all my neurons to come up with this option. But this is the simplest and cheapest solution you have. In fact, as good practice, you should be logging all the activities with different log levels. Obviously, you should use a log level of “TRACE” or “INFO” for your server-side digital marketing calls. And, what should you have in your logs?
At the very minimum, the URLs and the HTTP headers of the calls you are doing to Adobe’s servers. This includes calls to ECID, Analytics, Target and, if you must, Audience Manager. If you want to put more information, do so; in particular I would recommend more details about the parameters.
There are a couple of problems with this solution:
- In production servers, switching the log level may not be possible, as it can generate very long log files.
- There is a small possibility that the logged URL is not exactly the same as the URL which is actually fetch. The same applies to HTTP headers, cookies… Think of cases where the HTTP requests are managed by a 3rd party library, which could add more parameters, or a bug in your code that changes the URL between the log call and the HTTP request.
Using a proxy server
If the previous suggestion is not an alternative for you, there is still hope. In this third case, I am assuming that the server does not have direct access to the open Internet, for security reasons. There is a proxy (not only a firewall) between the server you are trying to debug and the Internet. In this case, you may be able to get the logs from this proxy server.
One final caveat: you must use HTTP calls or have the proxy server certificates in your server you are trying to debug. Otherwise, the proxy will just be a pass-through and you are left with no data to debug.
TCPdump and Wireshark
This is probably the most complex solution, but it is the one I have used successfully in the past and it has the least amount of pre-requisites. In my view, this solution is the last resort, in case no other options work, but feel free to use it whenever it suits you.
You will start by asking the administrator of the server (or any intermediate node between the server and the Internet) to run tcpdump and send you the output. All Linux servers should have this command, so, all you have to provide is the exact command to the administrator. The following is an example to capture only server-side ECID requests, while listening to Ethernet interface eth0 and generate a file named “ecid.pcap”.
$ tcpdump -i eth0 -w ecid.pcap "ip host dpm.demdex.net"
It is beyond the scope of this post to explain how to use tcpdump. Just remember to use your Analytics/Target/AAM servers in the filters, instead of dpm.demdex.net. I am not sure it is possible to create a simple catch-all filter, including all Adobe’s servers, as tcpdump filters do not allow wildcards. In any case, it is not a problem if you capture more packets than the bare minimum. In the next step, we are going to apply more filtering.
Once the tcpdump command has been executed and the administrator has sent you the capture file (“ecid.pcap” in the previous case), open it in Wireshark, which you should have installed in your laptop/desktop.
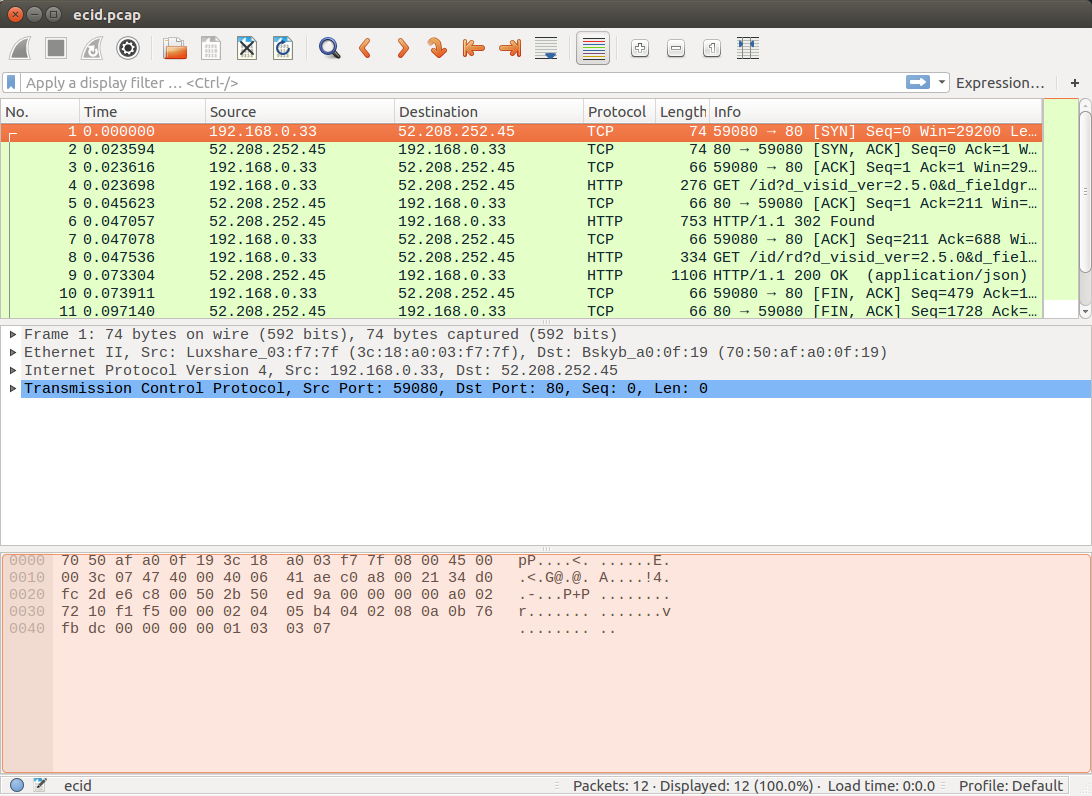
As you can see, it contains all the IP packets that have been exchanged between your server and dpm.demdex.net. Since we are only interested in the HTTP messages, just type “http” in the filter bar:
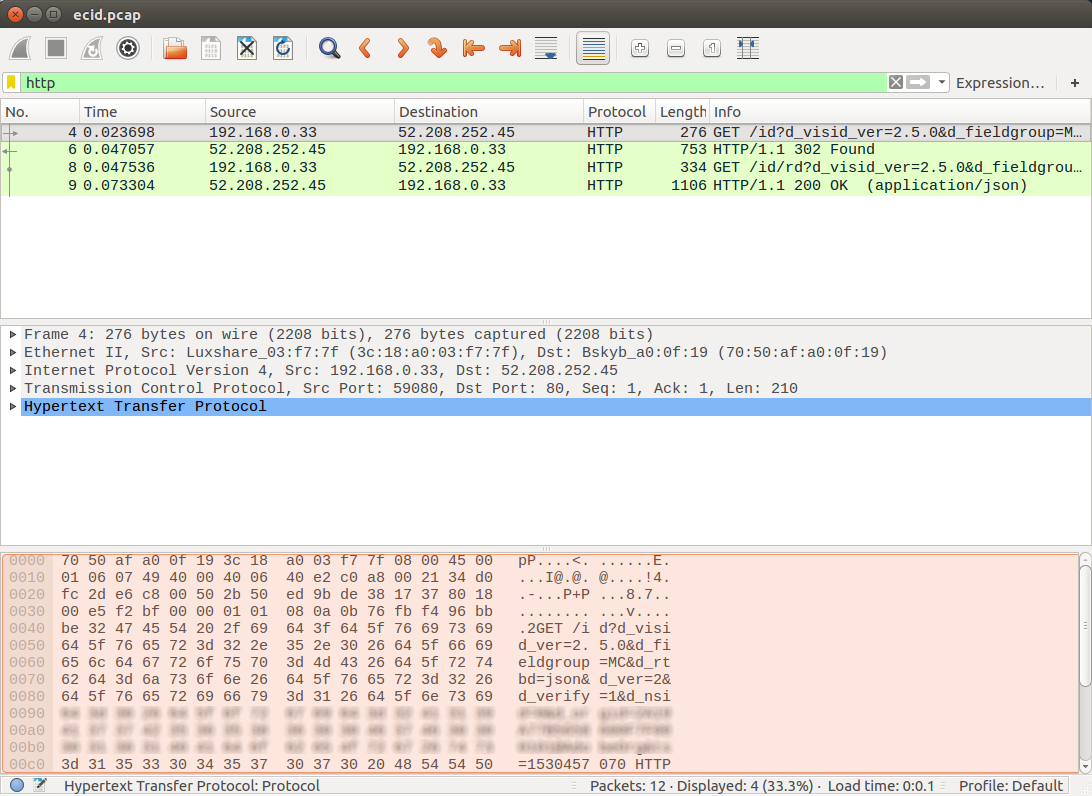
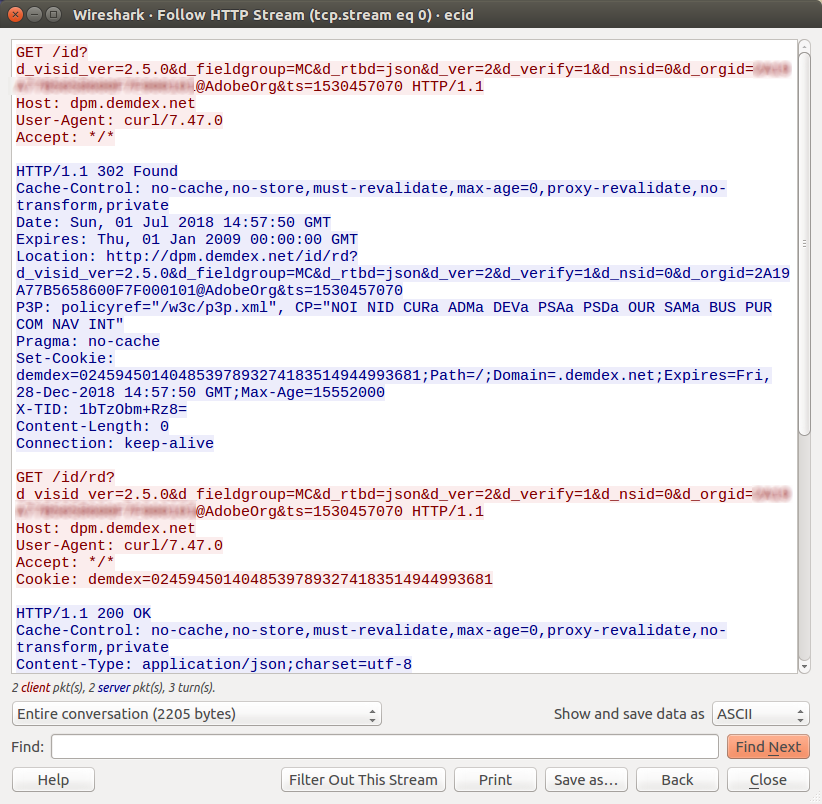
In this previous example, there is only one HTTP request. However, if you have many of them, you will want to analyse one by one. Scroll down until you see one of the HTTP messages that you are interested, right-click on it and select “Follow” > “HTTP stream”. This will open a new window, with all the HTTP messages of that particular stream.
That’s it!
Well, I might have been too optimistic with my description. There is one big caveat: as with the previous method, you can only debug HTTP using this method. This means that, while you are debugging, you need to switch to HTTP all your calls to Adobe’s servers. I recommend you have a configuration parameter to switch between HTTP and HTTPS. Only use HTTP for debugging and use HTTPS otherwise.
You might be think… “that sucks, I should always use HTTPS!” I could not agree more. However, the ‘S’ at the end is for Secure and the whole purpose of it is to avoid precisely what we are trying to do: snoop the flow of data between the servers. So, if we are to decipher the communication, we need to take some more steps. Wireshark supports SSL dissection, but it requires some certificates. The previous links explains how to generate them. In summary, when writing your server-side application, you need to store somewhere the certificates you have used when connecting to Adobe’s servers.
Once you have them, this blog post explains how to use them: https://jimshaver.net/2015/02/11/decrypting-tls-browser-traffic-with-wireshark-the-easy-way/. I am not sure it is worth the effort, though. What do you think?