
Metrics and dimensions in Adobe Analytics
25 Oct 2020 » Analytics Tips
In my previous post I explained what dimensions and metrics are in general, with a hint of how web analytics have interpreted them. In today’s post, I will address the next step: how Adobe Analytics has implemented these concepts.
Metrics
I will start with the metrics first, as it is easier and I can then better explain the dimensions.
Basic metrics
At the dawn of the web, the only thing that mattered were page views. A website’s worth was measured only on this metric. In fact, I am pretty sure this was the first metric in the web analytics space. Over time, more metrics were needed, like visits and visitors.
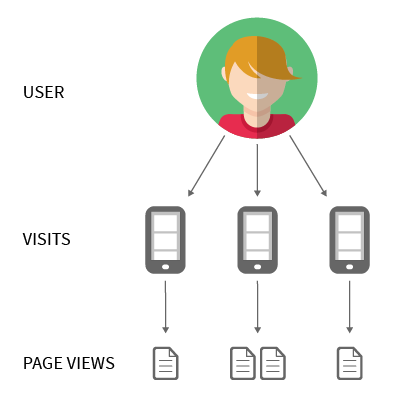
Any web analytics software back then could easily calculate these three metrics:
- Page views: every time a browser loads an HTML page.
- Visit: track the time between page views and, when there are more than 30 minutes between two consecutive page views from the same visitor, count a new visit.
- Visitor: drop a random cookie on each browser and count the total number of different cookies.
Advanced metrics
However, as web analytics matured, there was a need for more metrics. It was difficult and cumbersome to calculate things like purchases, form submissions or call-to-action clicks. This is when SiteCatalyst (or was it SuperStats?) added the s.events variable. For retailers, it included the typical shopping cart metrics: carts, adds to cart, cart views, checkouts and purchases. And, for everybody, custom events, to be used as metrics wherever you wanted.
When I started working, with SiteCatalyst 14, there were 100 events. Now there are 1000. In other words, you can now track virtually anything happening on your website.
Types of events
As I explained, metrics are always numbers. To cater for different use cases, Adobe Analytics has 3 types of metrics:
-
Counter events. They can only deal with natural numbers. Usually, we only increment them by one (
s.events="event12"), but you can add any increment; for example,s.events="event4=5"will incrementevent4by 5. - *Numeric events. In case you need real numbers (i.e. numbers with decimals), you should switch to this other type of events. In my experience, few implementations really need them.
- Currency events. It is based on the numeric event, but with a twist. Without getting into too many details, this metric converts your website currency into your reporting currency. For example, if your report suite is set in EUR, but you sell in multiple currencies depending on the country (EUR, USD, GBP, CHF), Adobe Analytics will convert them to EUR with the day’s exchange rate. A 3rd party provider sends these daily exchange rates to Adobe. Just remember that this value will not match your financial reports, as the conversion rates will be slightly different.
More information: events help section.
Dimensions
If you have been in a job interview for a role involving Adobe Analytics, it is very unlikely that one of the questions was “what are the commonalities between eVars and props”. The answer would have been very easy: both are dimensions and both take string values. On the other hand, I am quite sure that one of the questions was “what are the differences between eVars and props”, which requires a lengthy explanation. I will address precisely these differences here.
Traffic variables or props
I am not sure why we have these two terms. Usually, web analysts will talk about traffic variables and developers about props. It is probably more accurate to talk about the former, as page name or site section are not props, but are traffic variables. In summary, Adobe Analytics has some pre-defined traffic variables and 75 custom traffic variables, which you can use for whatever you want.
To keep things simple, traffic variables are dimensions associated with a page. Or, more specifically, with a call to Adobe Analytics collections servers, be it either s.t() or s.tl() . This is a very important detail, as these values do not persist beyond the call. If a traffic variable is omitted in a call, Analytics does nothing with it.
Conversion variable or eVars
Traffic variables appeared first and had limitations, which you can immediately see. There was a need for a more advanced data type: conversion variables or eVars. In this case, I think we can safely consider them synonyms. Your license will determine the number of conversion variables, which you can freely use.
Instead of being tied to the calls, Adobe Analytics persists their values. Once you set an eVar, its value is kept in the background in all subsequent calls, until you set a new value or the expiration event happens. This expiration is typically the end of the visit, but it can be any custom event or a time period. As a consequence, there needs to be a value at the beginning of time and after each expiration: “Unspecified” or “None”. I know this value tends to frustrate novices, but once you understand it, it even makes sense and provides additional information.
Dimensions and metrics
Dimensions or metrics on their own have very limited use. You can count number of page views, purchases or clicks, or you can collect a bunch of strings, but this does not give you much value. As I showed you in my previous post, the value shows up when you combine metrics and dimensions. Adobe Analytics was precisely built to allow for this combination, although not all options are available. In the next couple of sub-sections, you will understand how it works. It is important to understand this, as it will help you understand what reports are possible or make sense.
Note. If you are an advanced user of Adobe Analytics, you probably have realised that my explanation is not complete. I know, I am keeping it simple for beginners.
Traffic variables metrics
In the case of traffic variables, there is only one true dimension: occurrences. Adobe Analytics only counts the number of times it sees a particular value of a traffic variable in calls. You can also use visits and visitors as metrics, which will show how many visits or visitors saw a particular value. While there is value in this information, we can all agree it is not a lot. If you want to picture it in your mind in a different way, you can imagine 75 tables, with as many rows as the each prop’s values and 3 columns: occurrences, visits and visitors.
| prop1 | Occurrences | Visits | Visitors |
|---|---|---|---|
| abcdefg | 100 | 50 | 10 |
| hijilmn | 200 | 150 | 100 |
| opqurst | 20 | 15 | 10 |
Conversion variables metrics
In the case of conversion variables, you can now combine them with all custom dimension or events. Every time an event is set in s.events , all eVars’ persisted value at that moment in time, get their counters incremented according to the events. Let me explain this concept with an example, as it is key. If you set s.events="event7,event10" , Analytics will increment the event7 and the event10 counters of the current value of all eVars by one. And this includes the “Unspecified” value of all eVars that currently have no value.
But Adobe Analytics does not stop here. It does the same as with props. It counts the number of times it receives an eVar value (instances), number of times a value is received or persisted (occurrences), visits and visitor. Think of it as 250 tables (one per eVar), with as many rows as different values an eVar has and ~1000 columns.
| eVar1 | Instances | Visits | Visitors | event1 | event2 | … | event1000 |
|---|---|---|---|---|---|---|---|
| aaaaaaa | 1000 | 200 | 150 | 10 | 3 | 0 | |
| bbbbbbb | 2000 | 1500 | 1000 | 250 | 5 | 2 | |
| ccccccc | 600 | 400 | 200 | 800 | 400 | 10 |
Reports
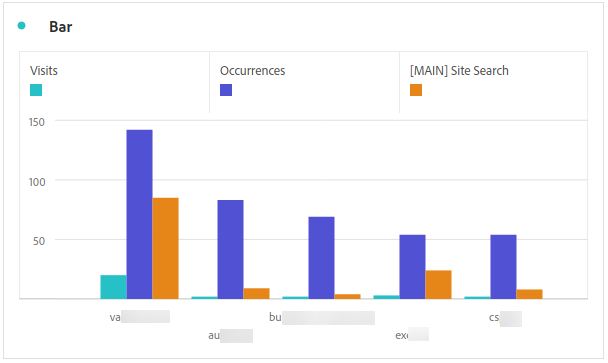
In the previous section, I have shown how Adobe Analytics combines metrics and dimensions and stores conceptually the data (I have no idea how it is really stored). However, what you really want to do with this data is to show it in a report. One of the features of Analytics is that you can show multiple metrics for a given dimension. I did not explain it in my post on dimensions and metrics, but it actually makes sense: since all metrics are numbers, they can all use the same y-axis.
In the following example, I am showing:
- Dimension: Search terms (eVar)
- Metrics:
- Visits
- Occurrences
- [MAIN] Site Search (event)
Some of you may be wondering why it took me so long to just show a report. My answer is that, in order to be a good web analyst, you not only need to know how to create reports, but also understand what you are actually doing. In summary, what I have demonstrated is how you start with the concept of dimensions and metrics and how it ends up becoming a report.