Adobe Analytics Data Warehouse
25 Nov 2018 » Analytics Tips
I tend to write about new features of Adobe tools or “cool” ways of using it. That does not mean that I have forgotten about good old features and this is what I am going to do today, explain one of the basic tools of Adobe Analytics: Data Warehouse.
What is Data Warehouse?
Obviously, I am not talking about the concept of a data warehouse, but what is the Data Warehouse in Adobe Analytics. Think of it as a huge database table, with:
- One column for each data point that can be captured in a hit. There are more than 1000 of those: eVars, props, event list, browser, country…
- One row for each hit. In a high-traffic website, there will be millions per day.
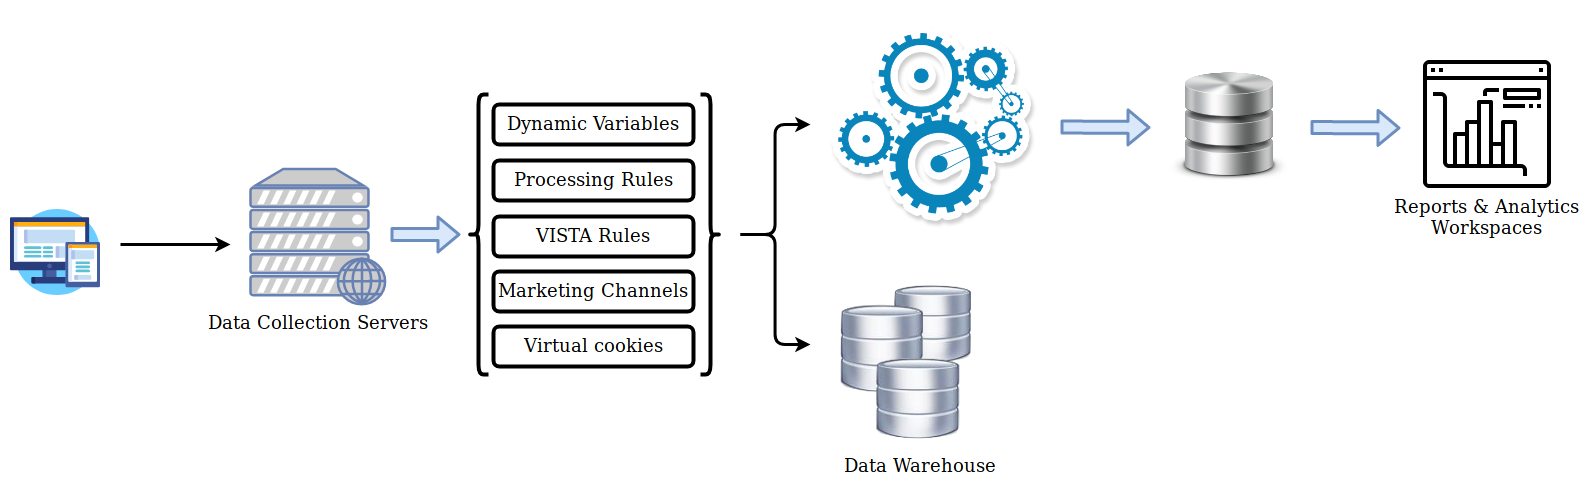
However, it is not a RDBMS that you can query, just a storage of raw data. Adobe Analytics does not use it for either Reports & Analytics or Workspaces. That would be impossible, as it would take hours to produce some reports. Instead, Adobe Analytics gets the hits, processes them and stores them in a separate database, which can be queried fast enough for a report to be produced in seconds.
In case the previous explanation is not clear, I have drawn a diagram that should clarify it:
One important consequence of the previous explanation is that the reports you will get from Data Warehouse will not be the same as in Reports & Analytics. The totals should be the same, but the presentation will be completely different. A Data Warehouse report will go line by line (i.e. hit by hit) and check if it qualifies for the report. Then, it will accumulate the metrics for the lines that have the same dimensions and present only one such line.
Finally, as you can see from the previous report, in Data Warehouse you also get the output from:
- Dynamic Variables
- Processing Rules
- VISTA Rules
- Marketing Channels Processing Rules
- Virtual cookie (i.e. eVar and list variables persistent values)
Permissions & Retention
Not everybody has access to these data and not all the data since the beginning of time is available.
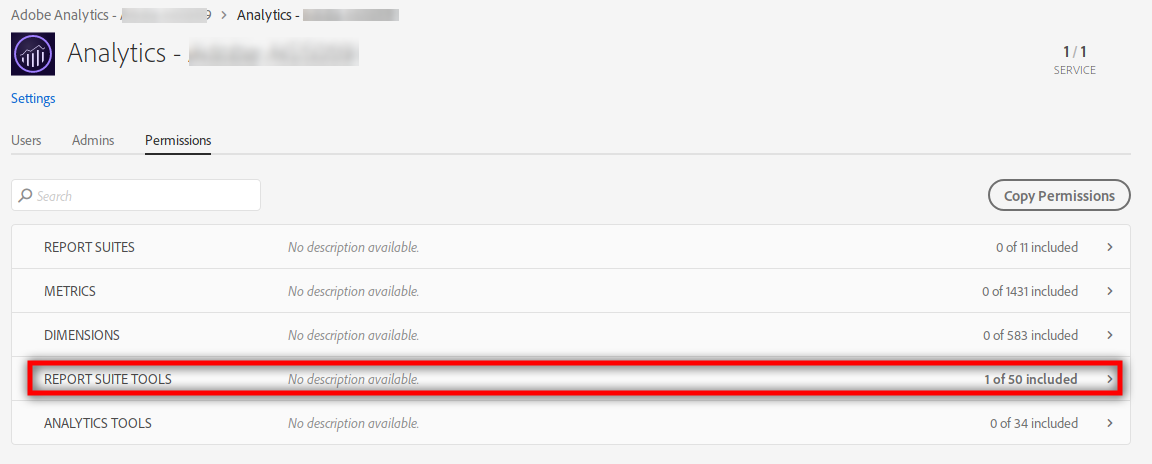
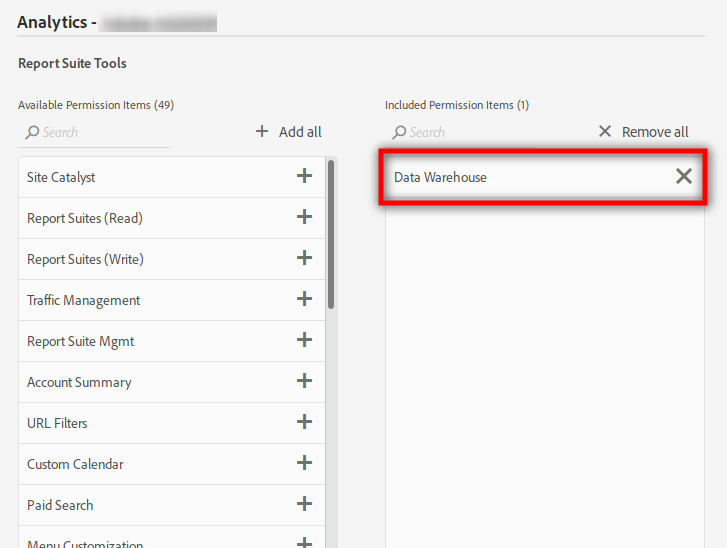
In order to access the data in Data Warehouse, you have the right permission. In the Admin Console, you need to have at least one Analytics product profile with access to Data Warehouse.
Regarding the data retention, and now that GDPR is in force, Adobe will only store usually the last 25 months. Check the details in this release note and see the comments about extending this value if you need more. Alternatively, you can also get the data feed and store it in your own data warehouse. This clickstream data feed comes also from Data Warehouse.
Use Cases
Many times, I get questions about the use cases of the features I explain in this blog. I must admit I tend to forget them. If you are wondering why would you want to use Data Warehouse, here are the most common cases:
- High cardinality reports. We all fear the dreaded Low Traffic value in Adobe Analytics. This happens if an eVar or prop gets more than 500,000 values during a month. This limitation does not apply to Data Warehouse reports and you will get all the values. However, expect huge reports if you request all the values.
- Long reports. If you need to get hundreds or thousands of rows in a report, Reports & Analytics or Workspaces will not allow you to do that. The place to go is, you guessed it, Data Warehouse.
- Automated processing. This is typically the case when you have another system that needs the input of Adobe Analytics, but the data feed is too much. You can create the report with the exact data you need, schedule it as a recurring report and send it to an SFTP account. The other system will read the data from there and process it.
Scheduling a Report
Let’s see how you schedule a report. And I am using the word “scheduling” on purpose, as this it not a real time report. It will take some time to be delivered, maybe a few hours.
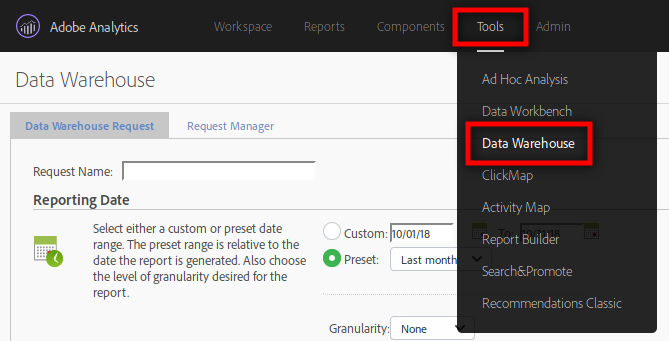
The first step is to go to the Data Warehouse UI:
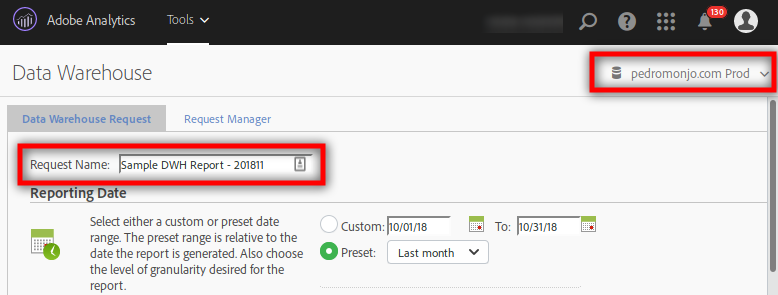
Then select the report suite on the right and set the report name. I suggest that you follow a naming convention, appending the date to the name.
Reporting Date
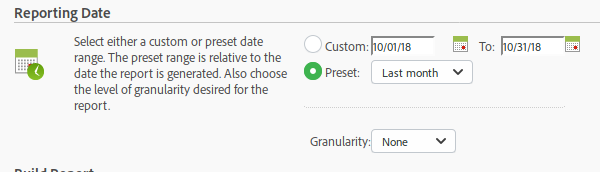
The next step is to select the date range you want in your report. You can either select a custom range or use a preset. Finally, you select the granularity. I found quite confusing this word initially, so I will explain it in more detail. Basically, this is how the Data Warehouse reporting process will group the data:
- None. Each row in the report will show the metrics for the full date range.
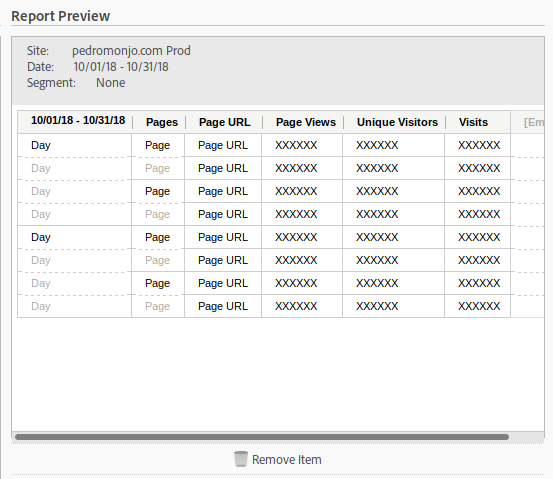
-
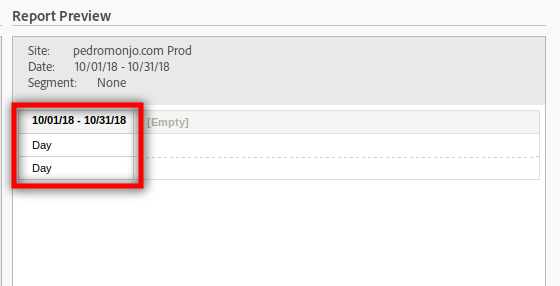
Hourly, Daily… Yearly. The data will be grouped by this data range. For example, selecting “Daily” means that, for every day in the range, the full report will be run for only that day and concatenated with the report of the previous day. What is even more important, in the “Report Preview”, the first column is added to reflect this selection:

One word of caution. When selecting a granularity, Adobe Analytics will insert a date in a non-configurable format. If you need to later process it, be ready to do some conversions.
Available Segments
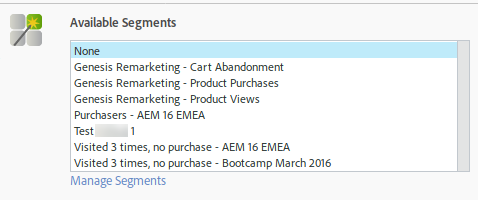
You are given the option to choose a segment for the report. Not all segments can be used in Data Warehouse. You will have noticed that, when you create a segment in the segment editor, it tells you which tools this segment will be available in:
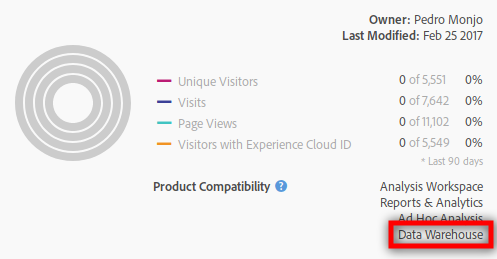
Obviously, only segments that are compatible with Data Warehouse will show up.
Finally, remember that a segment is a collection of hits. This is obvious for hit-level segments, but visit-level segments include all hits within the visit and visitor-level segments include all hits from a visitor. So, selecting a segment in Data Warehouse will create a report that includes only the hits that qualify for the segment.
Items
Now it is the time to select the data you want in your report.
You start with the breakdowns, which are your dimensions: traffic and conversion variables and segments. They are grouped by:
- Standard. Out of the box dimensions like browser, country or marketing channel. You even get access to dimensions not available in Reports & Analytics, while some other dimensions are incompatible.
- Custom. Your custom traffic (props) and custom conversion (eVars) variables.
- Segments. Additional segments you want to check.
You can add as many breakdowns as you want, but be careful with what you wish. The report will show all combinations of all values for each dimension, which grows exponentially as you add more dimensions. For example, if you select 3 dimensions, each of which has 10 values, your report may have 10x10x10=1,000 rows; if you do a daily breakdown for 1 month, you can potentially get up to 30x10x10x10=30,000 rows!
It is also important to know that there is no difference between props and eVars in this report and you can combine them in the report. This is a significant change from the Reports & Analytics interface. Remember that we are querying all the hits in the date range. For each hit, a prop will have the value of the hit and the eVar, either the value in the hit or its persistent value from the virtual cookie.
Then you select the metrics. Again, you have standard (out of the box) and custom (your events). They are always added after the dimensions:
If you make a mistake, you can move the columns or delete them: just drag the column name in the report preview to the new location or to the “Remove item” icon.
Schedule Delivery
You will be tempted to click on the “Request this Report” as soon as you have finished, but hold your horses. Data Warehouse report engine will refuse to send a report through email if it is too long (I believe the limit is 50,000 rows). So, in general, I suggest not changing anything in the “Schedule Delivery” section and clicking on “Advanced Delivery Options” to configure the delivery method.
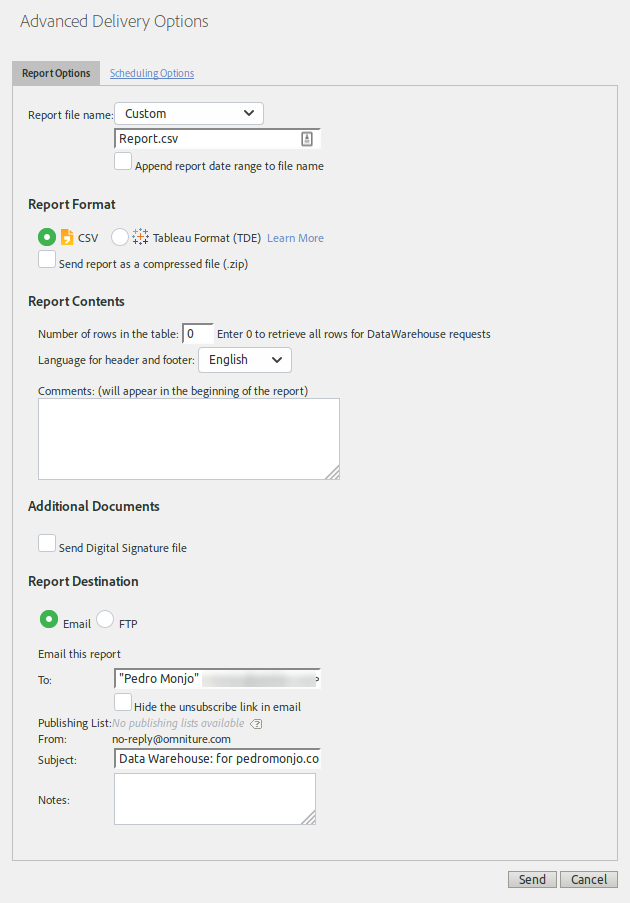
These are my recommendations for the parameters:
- Report file name. Select “Custom” and give it a sensible name. Avoid the default “Report.csv”. I do not select “Append report date range to file name” as I prefer to put this information in the file name myself.
- Report Format. Unless you are going to use Tableau, always select CSV and compress the file (.zip).
- Report Contents. I have never found any use of this section, so just leave it with the default values: no limit in number of rows, English language and no comments.
- Additional Document. Not sure what this is for and I have never needed it.
-
Report Destination. Two options:
- Email. Only if you know the size of the report will be very small.
- FTP. This includes both FTP and SFTP (but not FTPS). You will need your own (S)FTP server and here is where you configure the server details. Selecting port 22 will trigger SFTP.
If you need a recurring report, you should have selected one of the presets in the “Reporting Date” section. Then, in the “Advanced Delivery Options” pop-up, you can click on “Scheduling Options” and select “Schedule for later”:
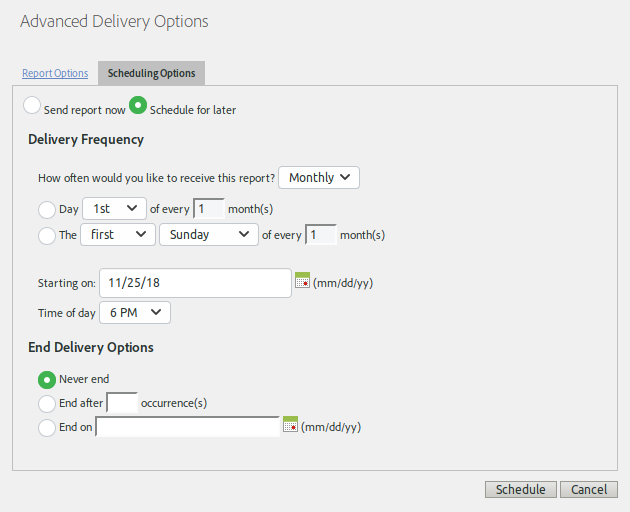
Configure it accordingly to your needs, there are plenty of options. One word of caution. Make sure that the report takes less time than the period you set, by running a few times manually.
Finally click on “Send” or “Schedule”. This is not the last step; you still have to click on “Request this Report”. It will take you to a confirmation page:
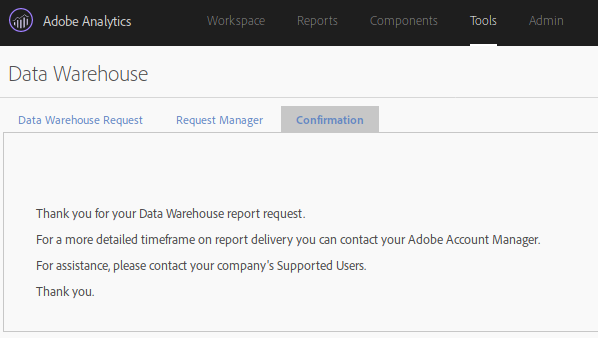
Now relax and wait for the Data Warehouse reporting engine to produce the report and send it. If you have chosen email, it will come as an attachment. Otherwise, it will be uploaded to your (S)FTP server and a confirmation email will be sent.
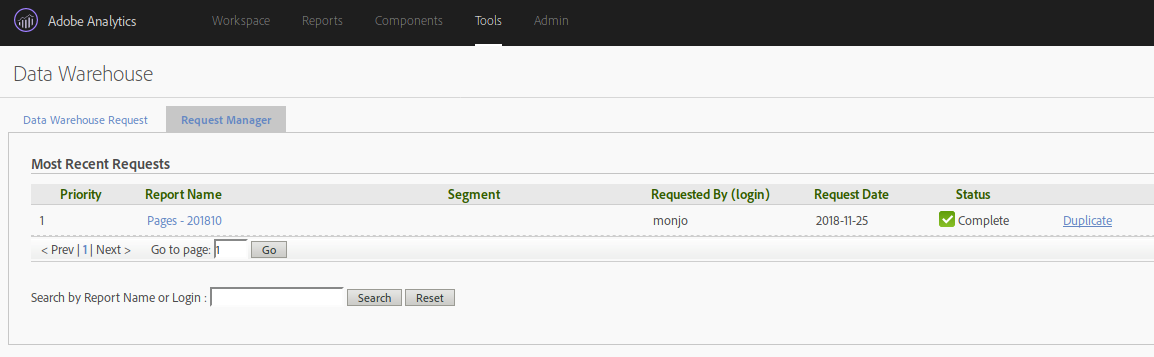
Request Manager
In a large organisation, it is very likely that many people request multiple reports. You can manage them from the “Request Manager” tab. The most interesting feature is the “Duplicate” link, which will start the request of a new report, with exactly the same configuration as that of the report you have selected.
The Report
Usually, you will open the report in a Spreadsheet application, like Libreoffice Calc or Microsoft Excel, since it is a CSV. One of the typical surprises is to see rows with empty values in the columns. There are the equivalent to “Null”s in Reports & Analytics.
Other than that, have fun with the data!