Out of stock - Basic reports
27 Jun 2015 » Analytics Tips
The wealthiest man in Spain (my home country) is the owner of Zara. There are Zara shops everywhere in the world. Just as an example, I was in Bangkok two months ago and I found a Zara store in one of the most popular shopping centres. The success of this company has been widely studied. One of the key success factors of this company is stock management. If you are interested in a detailed explanation, here you have a video that I found very interesting:
In real stores, the only way to determine if a product is popular or not is by the number of units sold. I am not saying that this is not useful, but the mathematical models used could benefit from additional metrics. In the online world, we can go one step further and include other metrics in the algorithm, like product views, add to carts and number of times it is out of stock.
With Adobe Analytics, product views, add to cart, remove from cart and orders are standard metrics that will be included in any typical retail implementation. On the other hand, there is no standard out-of-stock report. I am sure different people will have slightly different views on what “out of stock” is. For me, it is the number of times per visit a product has been shown to a visitor and it was out of stock.
Let me summarise why I chose this way of measuring. While a product is in stock, you can measure the popularity of a product using metrics like add to basket or units sold. However, the moment it is out of stock, you do not have any way to measure how popular it is: you just know it cannot be sold. It could well be that the product is not popular any more and you can just remove it from the inventory. Or, it might be the most popular product, with thousands of page views and frustrated visitors that cannot purchase it. With my solution, you can tell how popular an out-of-stock product is.
After this long introduction, let’s go to the implementation with Adobe Analytics. This is probably the simplest part of it. My suggestion is to use a cookie and a list prop:
- In the list prop, you set a comma separated list of product IDs that are shown and are out of stock. You need a list prop as it is possible that on one page there are many out of stock products.
- In the cookie, you should store the list of product IDs that have already been reported during that visit.
I would like to show you some code, but since it entirely depends on each implementation, I will just show you the results. Surprisingly, the best example is a bra web page, as it has many different sizes:
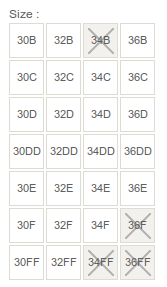
In this example, there are four sizes out of stock, so the list prop will get four values (I used the pipe as the separator):
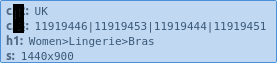
Since we do not want to continuously be reporting these values for this session, I keep the value in a cookie. Before setting the prop, a piece of JavaScript checks whether the value has already been reported.

Finally, the report looks like:
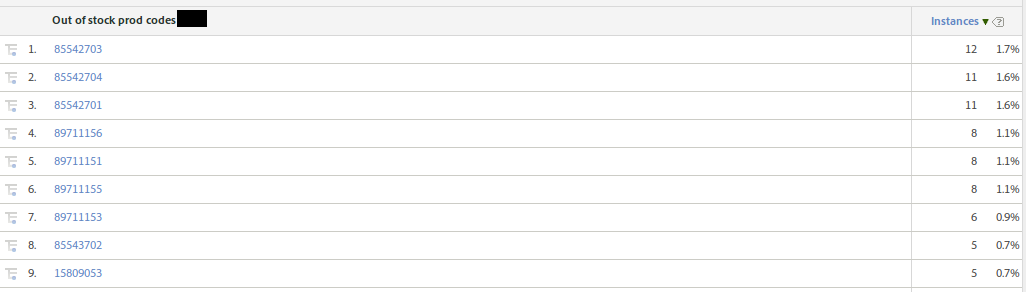
In this case, I am only interested in instances, but visits and visitors are other valid metrics that can be useful. An alternative would be to remove the cookie and always report the products. In the end, it will depend on how you want to use those values.